This forum is disabled, please visit https://forum.opencv.org
| | 1 | initial version |
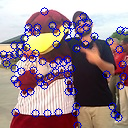
the output is not an image, but a list of 2d points. please see docs
Mat gray; cvtColor(ocv,gray,COLOR_BGR2GRAY);
vector<point> gftt; goodFeaturesToTrack(gray, gftt, 100, 0.1, 5);
for (size_t i=0; i<gftt.size(); i++)="" circle(ocv,="" gftt[i],="" 4,="" scalar(200,0,0));<="" p="">
| | 2 | No.2 Revision |
the output is not an image, but a list of 2d points. please see docs
vector<point>
| | 3 | No.3 Revision |
the output is not an image, but a list of 2d points. please see docs
Mat gray; cvtColor(ocv,gray,COLOR_BGR2GRAY);

vector<Point> gftt;
goodFeaturesToTrack(gray, gftt, 100, 0.1, 5);

for (size_t i=0; i<gftt.size(); i++)
    circle(ocv, gftt[i], 4, Scalar(200,0,0));

| | 4 | No.4 Revision |
the output is not an image, but a list of 2d points. please see docs
Mat gray; cvtColor(ocv,gray,COLOR_BGR2GRAY);

vector<Point> gftt;
goodFeaturesToTrack(gray, gftt, 100, 0.1, 5);

for (size_t i=0; i<gftt.size(); i++)
    circle(ocv, gftt[i], 4, Scalar(200,0,0));

imshow("Output", ocv);