This forum is disabled, please visit https://forum.opencv.org
| | 1 | initial version |
search for finding local maximum in a matrix. With a fast search I found this one.
| | 2 | No.2 Revision |
search for finding local maximum in a matrix. With a fast search I found this one.. I think that it is what you are looking for.
| | 3 | No.3 Revision |
search for finding local maximum in a matrix. With a fast search I found this one. I think that it is what you are looking for.
edit:
Since the code in the above link was a bit outdated, I transformed it a bit including also the drawing functions.
#include <iostream>
#include <opencv2/opencv.hpp>
using namespace std;
using namespace cv;
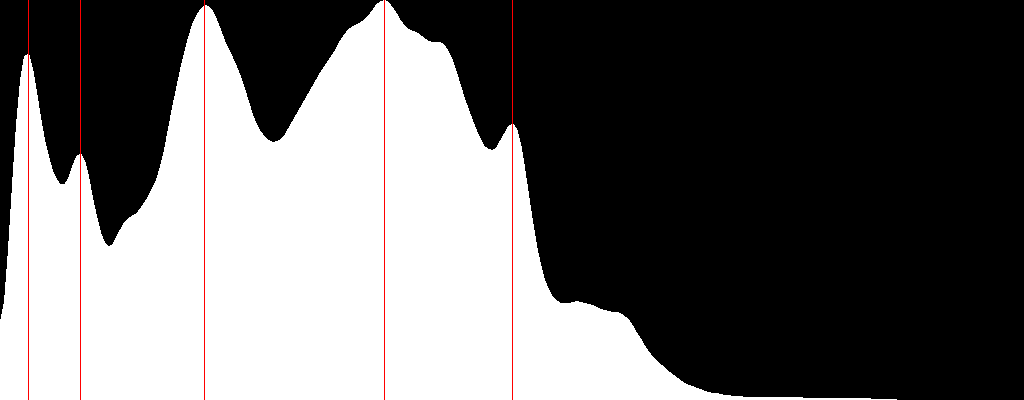
int drawPeaks(Mat &histImage, vector<int>& peaks, int hist_size = 256, Scalar color = Scalar(0, 0, 255))
{
int bin_w = cvRound( (double) histImage.cols / hist_size );
for(size_t i = 0; i < peaks.size(); i++)
line(histImage, Point(bin_w * peaks[i], histImage.rows), Point(bin_w * peaks[i], 0), color);
imshow("Peaks", histImage);
return EXIT_SUCCESS;
}
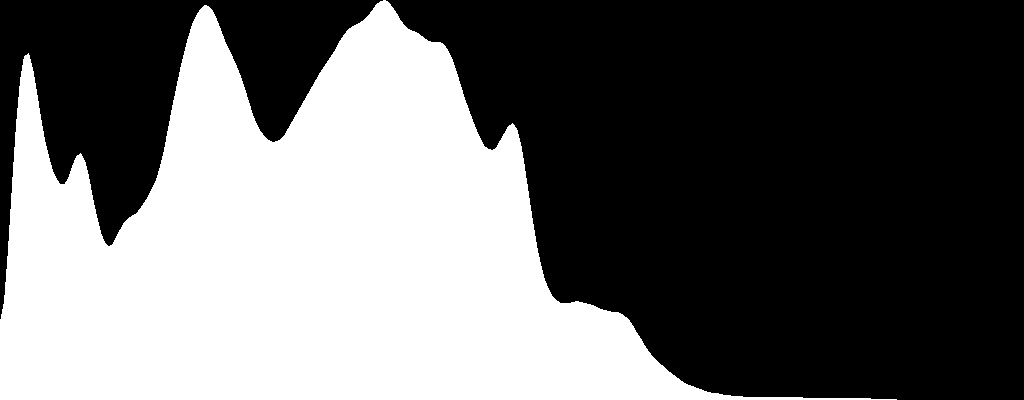
Mat drawHistogram(Mat &hist, int hist_h = 400, int hist_w = 1024, int hist_size = 256, Scalar color = Scalar(255, 255, 255), int type = 2)
{
int bin_w = cvRound( (double) hist_w/hist_size );
Mat histImage( hist_h, hist_w, CV_8UC3, Scalar( 0,0,0) );
/// Normalize the result to [ 0, histImage.rows ]
normalize(hist, hist, 0, histImage.rows, NORM_MINMAX, -1, Mat() );
switch (type) {
case 1:
for(int i = 0; i < histImage.cols; i++)
{
const unsigned x = i;
const unsigned y = hist_h;
line(histImage, Point(bin_w * x, y),
Point(bin_w * x, y - cvRound(hist.at<float>(i))),
color);
}
break;
case 2:
for( int i = 1; i < hist_size; ++i)
{
Point pt1 = Point(bin_w * (i-1), hist_h);
Point pt2 = Point(bin_w * i, hist_h);
Point pt3 = Point(bin_w * i, hist_h - cvRound(hist.at<float>(i)));
Point pt4 = Point(bin_w * (i-1), hist_h - cvRound(hist.at<float>(i-1)));
Point pts[] = {pt1, pt2, pt3, pt4, pt1};
fillConvexPoly(histImage, pts, 5, color);
}
break;
default:
for( int i = 1; i < hist_size; ++i)
{
line( histImage, Point( bin_w * (i-1), hist_h - cvRound(hist.at<float>(i-1))) ,
Point( bin_w * (i), hist_h - cvRound(hist.at<float>(i))),
color, 1, 8, 0);
}
break;
}
imshow("Histogram", histImage);
return histImage;
}
struct Length
{
int pos1;
int pos2;
int size()
{
return pos2 - pos1 +1;
}
};
struct PeakInfo
{
int pos;
int left_size;
int right_size;
float value;
};
PeakInfo peakInfo(int pos, int left_size, int right_size, float value)
{
PeakInfo output;
output.pos = pos;
output.left_size = left_size;
output.right_size = right_size;
output.value = value;
return output;
}
vector<PeakInfo> findPeaks(InputArray _src, int window_size)
{
Mat src = _src.getMat();
Mat slope_mat = src.clone();
// Transform initial matrix into 1channel, and 1 row matrix
Mat src2 = src.reshape(1, 1);
int size = window_size / 2;
Length up_hill, down_hill;
vector<PeakInfo> output;
int pre_state = 0;
int i = size;
while(i < src2.cols - size)
{
float cur_state = src2.at<float>(i + size) - src2.at<float>(i - size);
if(cur_state > 0)
cur_state = 2;
else if(cur_state < 0)
cur_state = 1;
else cur_state = 0;
// In case you want to check how the slope looks like
slope_mat.at<float>(i) = cur_state;
if(pre_state == 0 && cur_state == 2)
up_hill.pos1 = i;
else if(pre_state == 2 && cur_state == 1)
{
up_hill.pos2 = i - 1;
down_hill.pos1 = i;
}
if((pre_state == 1 && cur_state == 2) || (pre_state == 1 && cur_state == 0))
{
down_hill.pos2 = i - 1;
int max_pos = up_hill.pos2;
if(src2.at<float>(up_hill.pos2) < src2.at<float>(down_hill.pos1))
max_pos = down_hill.pos1;
PeakInfo peak_info = peakInfo(max_pos, up_hill.size(), down_hill.size(), src2.at<float>(max_pos));
output.push_back(peak_info);
}
i++;
pre_state = (int)cur_state;
}
return output;
}
vector<int> getLocalMaximum(InputArray _src, int smooth_size = 9, int neighbor_size = 3, float peak_per = 0.5) //if you play with the peak_per attribute value, you can increase/decrease the number of peaks found
{
Mat src = _src.getMat().clone();
vector<int> output;
GaussianBlur(src, src, Size(smooth_size, smooth_size), 0);
vector<PeakInfo> peaks = findPeaks(src, neighbor_size);
double min_val, max_val;
minMaxLoc(src, &min_val, &max_val);
for(size_t i = 0; i < peaks.size(); i++)
{
if(peaks[i].value > max_val * peak_per && peaks[i].left_size >= 2 && peaks[i].right_size >= 2)
output.push_back(peaks[i].pos);
}
Mat histImg = drawHistogram(src);
drawPeaks(histImg, output);
return output;
}
int main()
{
Mat src, dst,src1;
/// Load image
src = imread( "fruits.jpg", CV_LOAD_IMAGE_COLOR );
if( !src.data )
{ return -1; }
cvtColor(src,src1,CV_RGB2GRAY);
/// Establish the number of bins
int histSize = 256;
/// Set the ranges ( for B,G,R) )
float range[] = { 0, 256 } ;
const float* histRange = { range };
bool uniform = true; bool accumulate = false;
Mat b_hist;
/// Compute the histograms:
calcHist( &src1, 1, 0, Mat(), b_hist, 1, &histSize, &histRange, uniform, accumulate );
vector<int> peaks = getLocalMaximum(b_hist);
waitKey(0);
return 0;
}
so you just need to call the get LocalMaximum() function with extracted histogram matrix as an attribute. Moreover, I was trying to figure out what changes to make in order to create a function similar to findPeaks() (e.g. findValleys()) that finds the valleys instead but I had some difficulties. If someone could give a hint in order to have a complete code in case that someone needs it in the future, it would be nice. By the way @berak I tried to follow your concept according to your suggestion, but I had some difficulties.
