This forum is disabled, please visit https://forum.opencv.org
| | 1 | initial version |
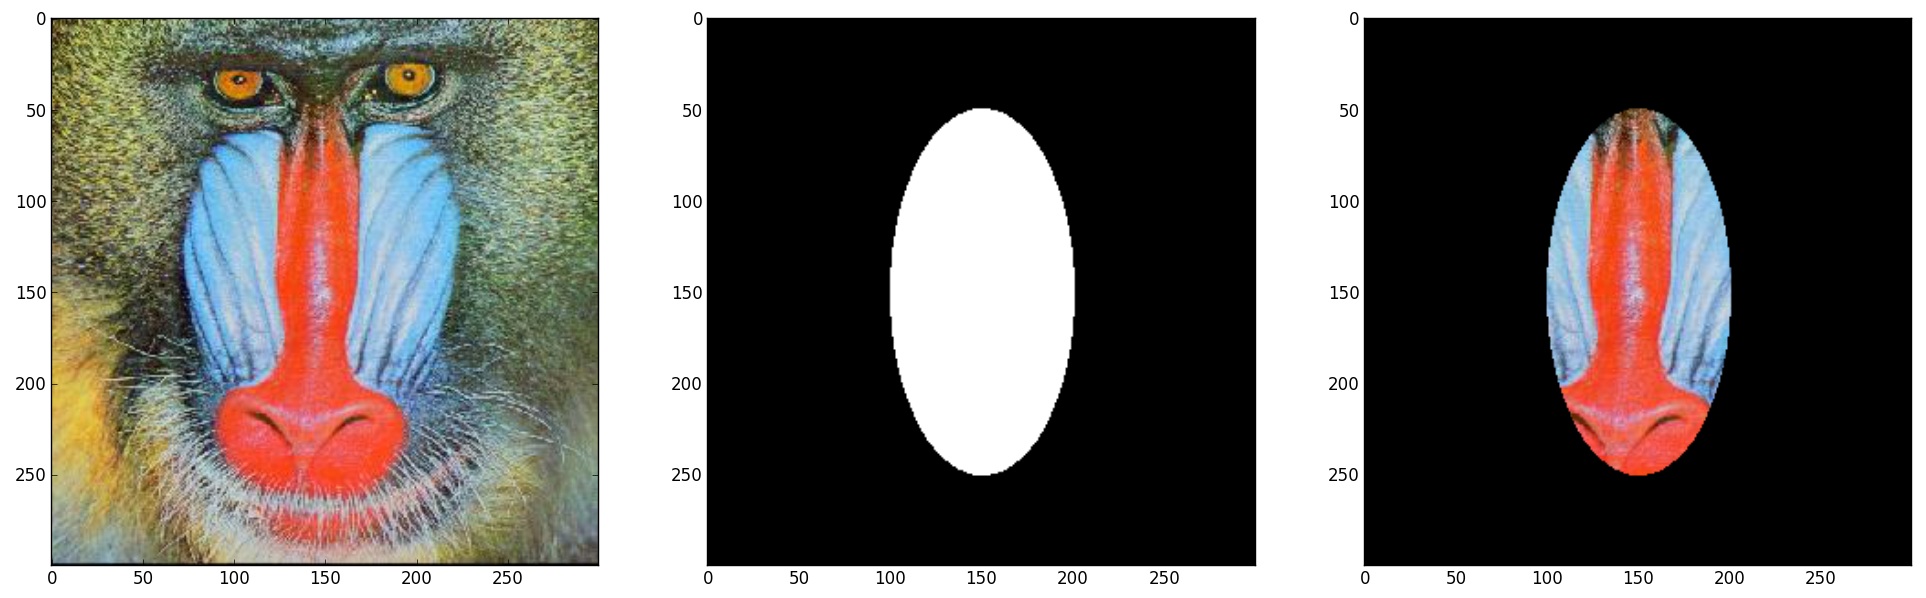
There isn't a straightforward way to extract the ellipse. But you may use a mask image to extract the elliptical patch with the rest of the region blacked out.
First, define a mask image which has a white ellipse on a black background. Then use a bitwise and operation to extract the patch.
Python code:
import cv2 import numpy as np import matplotlib.pyplot as plt
image = cv2.imread('baboon.jpg')
# create a mask image of the same shape as input image, filled with 0s (black color)
mask = np.zeros_like(image)
rows, cols,_ = mask.shape
# create a white filled ellipse
mask=cv2.ellipse(mask, center=(rows/2, cols/2), axes=(50,100), angle=0, startAngle=0, endAngle=360, color=(255,255,255), thickness=-1)
# Bitwise AND operation to black out regions outside the mask
result = np.bitwise_and(image,mask)
# Convert from BGR to RGB for displaying correctly in matplotlib
# Note that you needn't do this for displaying using OpenCV's imshow()
image_rgb = cv2.cvtColor(image, cv2.COLOR_BGR2RGB)
mask_rgb = cv2.cvtColor(mask, cv2.COLOR_BGR2RGB)
result_rgb = cv2.cvtColor(result, cv2.COLOR_BGR2RGB)
# Plotting the results
plt.subplot(131)
plt.imshow(image_rgb)
plt.subplot(132)
plt.imshow(mask_rgb)
plt.subplot(133)
plt.imshow(result_rgb)
plt.show()
Plot:
| | 2 | Corrected code blocks |
There isn't a straightforward way to extract the ellipse. But you may use a mask image to extract the elliptical patch with the rest of the region blacked out.
First, define a mask image which has a white ellipse on a black background. Then use a bitwise and operation to extract the patch.
Python code:
Plot: