This forum is disabled, please visit https://forum.opencv.org
 | 1 | initial version |
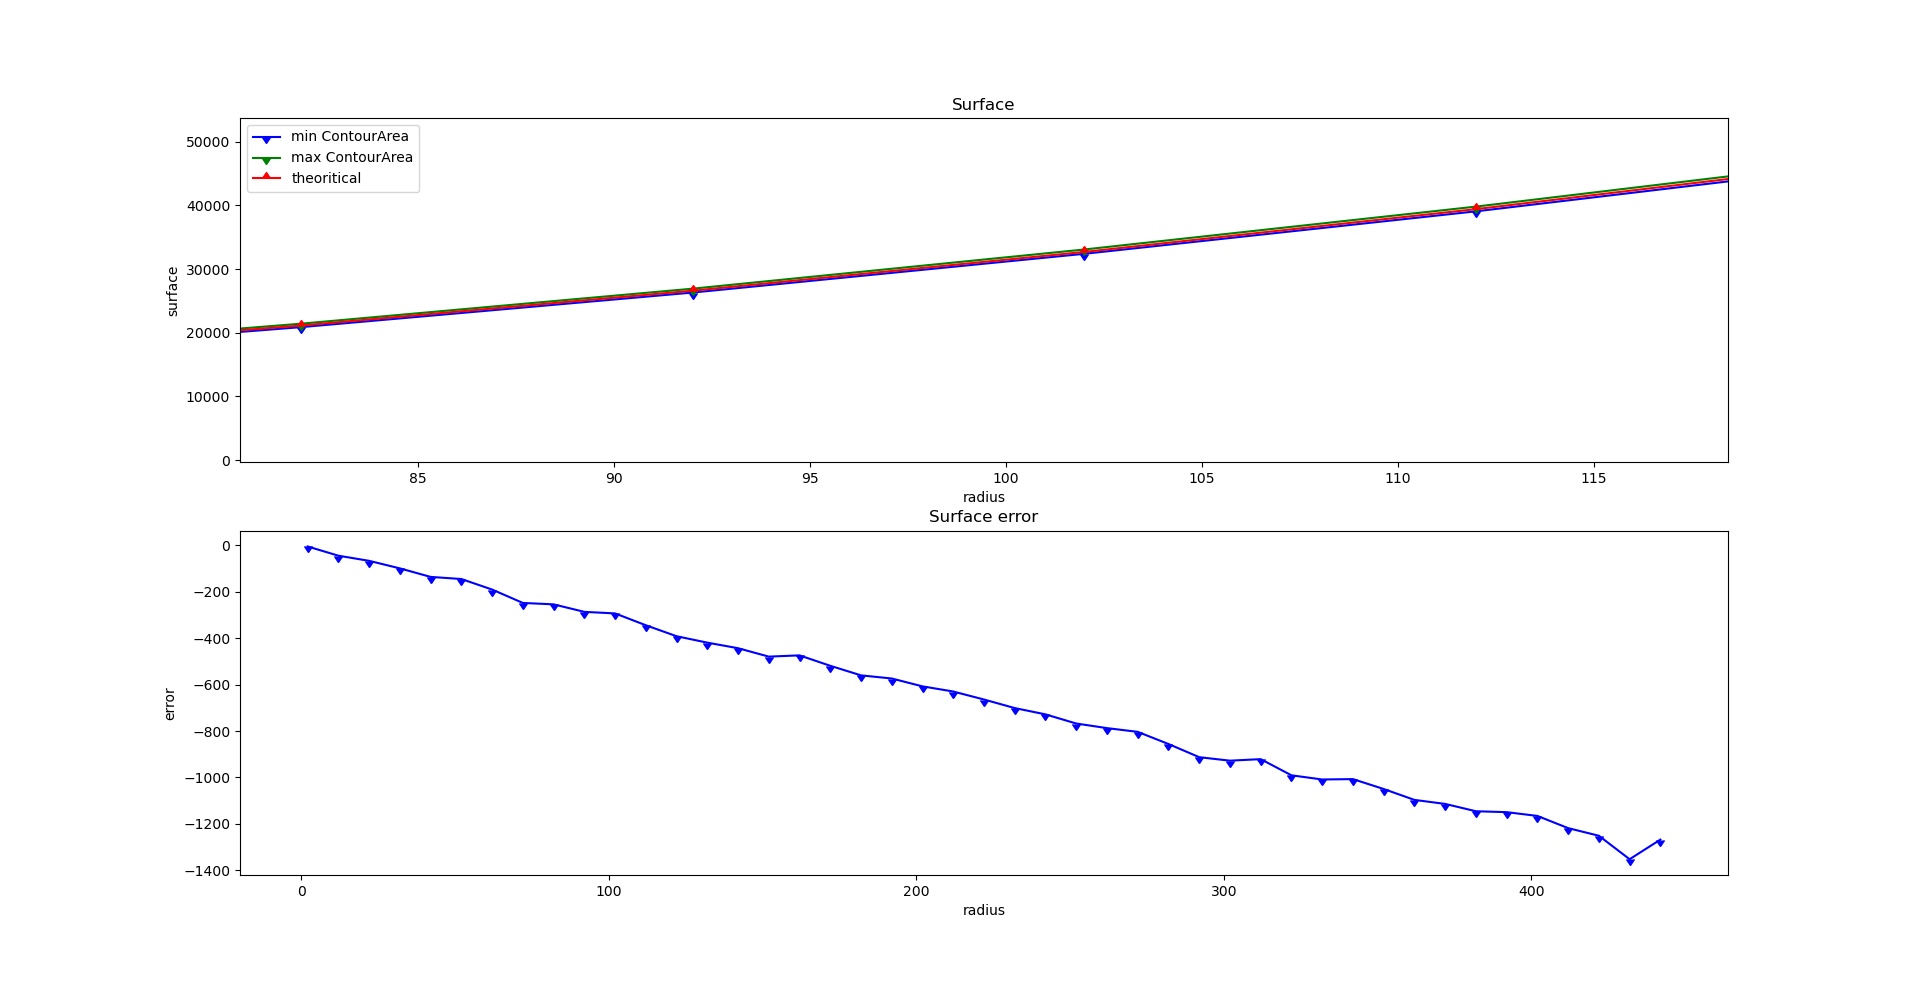
Discrete geometry is not continuous geometry . you can plot theoritical and measure values :
 You can estimate surface error using perimeter
import numpy as np
import cv2 as cv
import matplotlib.pyplot as plt

perimeter = []
surface = []
rayon = np.arange(2,450,10)
for r in rayon:
    img = np.zeros((1000,1000),np.uint8)
    img = cv.circle(img, (500, 500), r, 255, -1)
    ctr, hierarchy = cv.findContours(img, cv.RETR_EXTERNAL,  cv.CHAIN_APPROX_NONE)
    if len(ctr) != 1:
        print('Must not occured')
    for c in ctr:
        surface.append(cv.contourArea(c))
        perimeter.append(cv.arcLength(c, True))
print(surface)

plt.subplot(2, 1,1)
plt.plot(rayon, surface, 'b',marker = 11)
plt.plot(rayon, np.array(surface) + np.array(perimeter) , 'g',marker = 11)
plt.plot(rayon, rayon**2 * np.pi, 'r',marker = 10)
plt.title('Surface')
plt.ylabel('surface')
plt.xlabel('radius')
plt.legend(['min ContourArea','max ContourArea','theoritical'])
plt.subplot(2, 1,2)
plt.plot(rayon, surface - rayon**2 * np.pi, 'b',marker = 11)
plt.title('Surface error')
plt.ylabel('error')
plt.xlabel('radius')


plt.show()
plt.subplot(2, 1,1)
plt.plot(rayon, perimeter, 'b',marker = 11)
plt.plot(rayon, rayon*2 * np.pi, 'r',marker = 10)
plt.ylabel('perimeter')
plt.xlabel('radius')
plt.legend(['arcLength','theoritical'])
plt.subplot(2, 1,2)
plt.plot(rayon, perimeter - rayon*2 * np.pi, 'b',marker = 11)
plt.title('Perimeter error')
plt.ylabel('error')
plt.xlabel('radius')
plt.show()
 | 2 | No.2 Revision |
Discrete geometry is not continuous geometry . you can plot theoritical and measure values :
 You can estimate surface error using perimeter
For perimeter error is a function of contour length (number of pixel)
import numpy as np
import cv2 as cv
import matplotlib.pyplot as plt

perimeter = []
surface = []
rayon = np.arange(2,450,10)
for r in rayon:
    img = np.zeros((1000,1000),np.uint8)
    img = cv.circle(img, (500, 500), r, 255, -1)
    ctr, hierarchy = cv.findContours(img, cv.RETR_EXTERNAL,  cv.CHAIN_APPROX_NONE)
    if len(ctr) != 1:
        print('Must not occured')
    for c in ctr:
        surface.append(cv.contourArea(c))
        perimeter.append(cv.arcLength(c, True))
print(surface)

plt.subplot(2, 1,1)
plt.plot(rayon, surface, 'b',marker = 11)
plt.plot(rayon, np.array(surface) + np.array(perimeter) , 'g',marker = 11)
plt.plot(rayon, rayon**2 * np.pi, 'r',marker = 10)
plt.title('Surface')
plt.ylabel('surface')
plt.xlabel('radius')
plt.legend(['min ContourArea','max ContourArea','theoritical'])
plt.subplot(2, 1,2)
plt.plot(rayon, surface - rayon**2 * np.pi, 'b',marker = 11)
plt.title('Surface error')
plt.ylabel('error')
plt.xlabel('radius')


plt.show()
plt.subplot(2, 1,1)
plt.plot(rayon, perimeter, 'b',marker = 11)
plt.plot(rayon, rayon*2 * np.pi, 'r',marker = 10)
plt.ylabel('perimeter')
plt.xlabel('radius')
plt.legend(['arcLength','theoritical'])
plt.subplot(2, 1,2)
plt.plot(rayon, perimeter - rayon*2 * np.pi, 'b',marker = 11)
plt.title('Perimeter error')
plt.ylabel('error')
plt.xlabel('radius')
plt.show()