This forum is disabled, please visit https://forum.opencv.org
| | 1 | initial version |
2 steps are required:
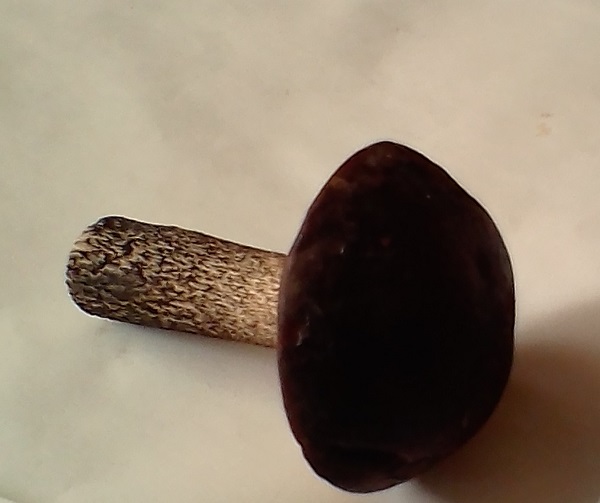
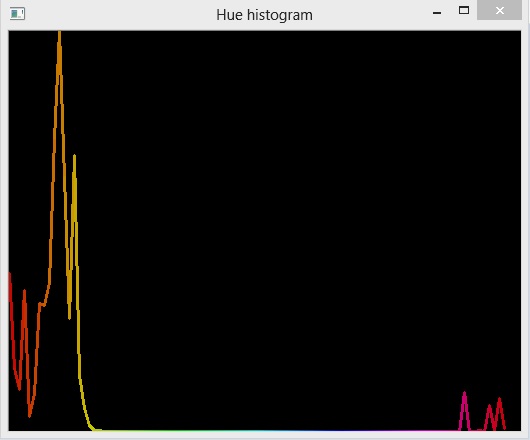
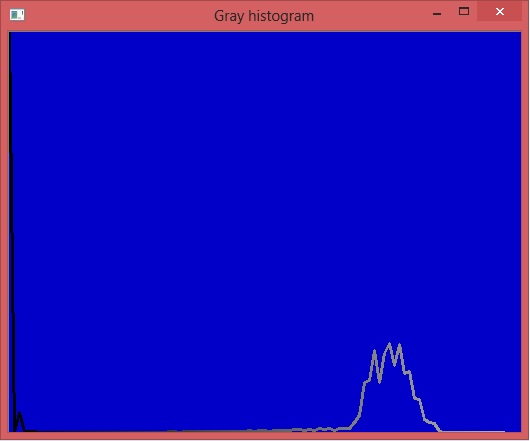
Peaks on the first histogram are used to detect main colors. Peaks on the second - for black, gray, and white. You may be satisfied by gray only or subdivide it further: dark gray, gray, light gray ... There are 3 colors on this picture: white, black, and brown.
| | 2 | No.2 Revision |
2 steps are required:
Peaks on the first histogram are used to detect main colors. Peaks on the second - for black, gray, and white. You may be satisfied by gray only or subdivide it further: dark gray, gray, light gray ... There are 3 colors on this picture: white, black, and brown.
| | 3 | No.3 Revision |
2 steps are required:
Peaks on the first histogram are used to detect main colors. Peaks on the second - for black, gray, and white. You may be satisfied by gray only or subdivide it further: dark gray, gray, light gray ... There are 3 colors on this picture: white, black, and brown.
| | 4 | No.4 Revision |
2 steps are required:
Peaks on the first histogram are used to detect main colors. Peaks on the second - for black, gray, and white. You may be satisfied by gray only or subdivide it further: dark gray, gray, light gray ... There are 3 colors on this picture: white, black, and brown.
P.S.
Matters turn much more complicated. This algorithm works incorrectly because the black may be colored. A better version:
Choose some threshold of saturation and use it to split the image into two. The first will contain only gray pixels, the second - only colors.
Choose some threshold of v(alue). Everything below it from both sources will be black. Use those pixels as needed, then filter out. Don't fill them with Scalar(0,0,0). This will create problems in histogram calculation because this is a meaningful black pixel. Mark them in mask array and supply it for calcHist() later.
Split both remaining images into 3 planes: h1, s1, v1 and h2, s2, v2.
Create the histogram of h2-plane and use its peaks to detect main colors.
Create the histogram of v1-plane and use its peaks to detect gray and white.
This may seem boring, but you will be rewarded by results. The previous histogram was smoothed. This is not.
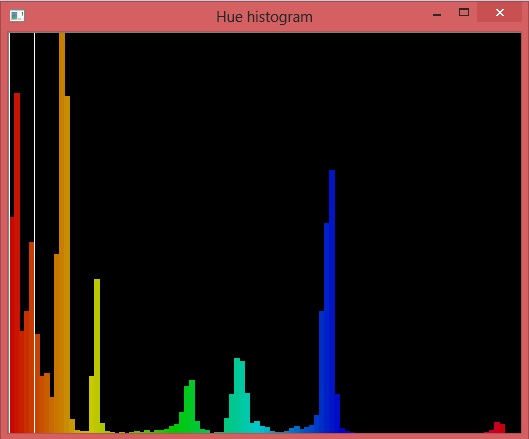
Histograms become less noisy, peaks - smooth, distinct, and sharp. Enjoy.