This forum is disabled, please visit https://forum.opencv.org
| | 1 | initial version |
well, 2 ideas here:
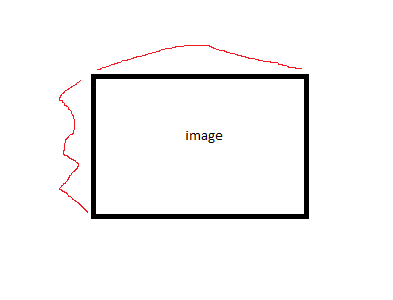
one could generate a heightmap from x and y curves, like in this silly drawing:
and the resulting intensity distribution would be simply the outer product of the curves:
Mat intensity = curve_x * curve_y.t();
(and that's also where the 2d splines are back !)
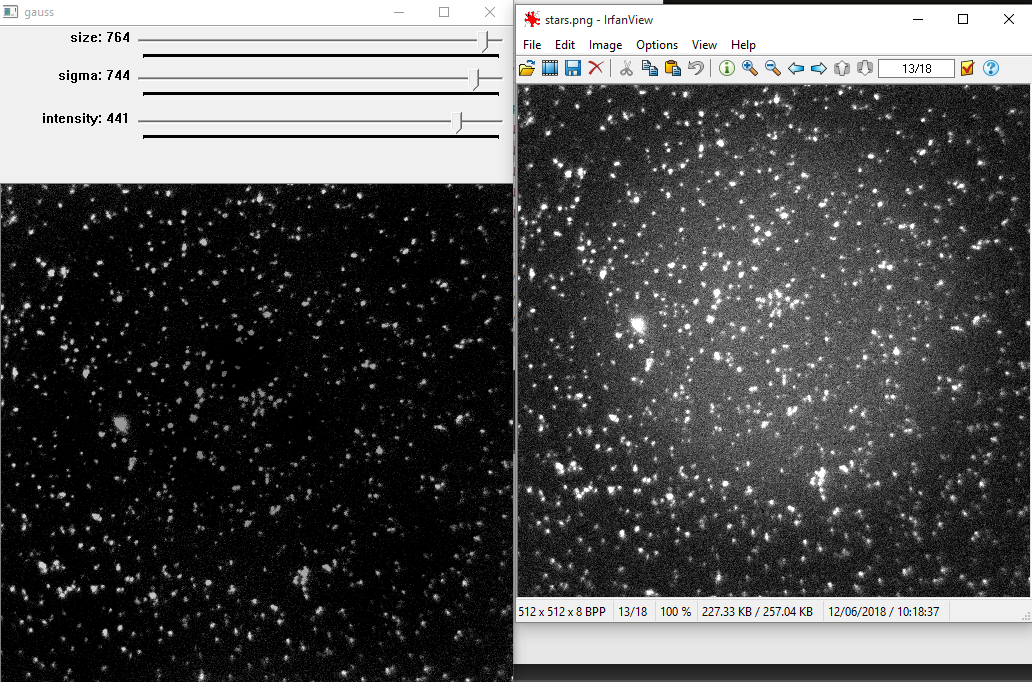
but also, your background noise is basically a gaussian distribution. (or maybe a mix of gaussians), so probably a simple mouse painting tool (where you subtract such blobs on every click) might do the trick already:
#include<opencv2/opencv.hpp>
#include<iostream>
using namespace cv;
using namespace std;

Mat gauss_blob(int siz, float sig) {
    Mat k = getGaussianKernel(siz*2+1, sig, CV_32F);
    return k*k.t();
}
int border=800; // max kernel size
int t_int = 220;
int t_sig = 200;
int t_siz = 100;
Mat img;

void on_mouse(int e, int x, int y, int s, void*) {
    if (e==1) {
        Rect r(border+x-t_siz, border+y-t_siz, 2*t_siz+1, 2*t_siz+1);
        Mat patch(img,r);
        Mat blob = gauss_blob(t_siz, float(t_sig)/10);
        patch -= t_int * blob;
    }
    if (e==2) ;// r-click, *add* the blob for undo.
}


int main(void) {
    img = imread("stars.png", 0);
    img.convertTo(img, CV_32F, 1.0/255);
    // make sure we stay inside the image
    Rect show(border,border,img.cols,img.rows);
    copyMakeBorder(img,img,border,border,border,border,BORDER_CONSTANT,Scalar(0));

    namedWindow("gauss");
    createTrackbar("size", "gauss", &t_siz, 800);
    createTrackbar("sigma", "gauss", &t_sig, 800);
    createTrackbar("intensity", "gauss", &t_int, 500);
    setMouseCallback("gauss", on_mouse);
    while(1) {
        imshow("gauss", img(show));
        if (waitKey(5) == 27) break;
    }
    return(0);
}