This forum is disabled, please visit https://forum.opencv.org
| | 1 | initial version |
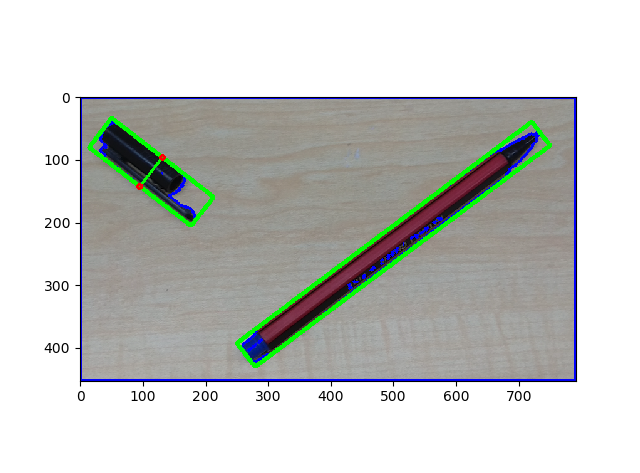
Hi, I've drawn one line in my poor code T_T, but I don't have time now to transform it into the iterative one: draw parallel lines along the shorter side to divide the rect into 2, 4, 8, ... parts, hope this can help you a bit:)
I'll try to spare time to turn it into a iterative one.
import cv2
import numpy as np
import matplotlib.pyplot as plt


img = cv2.imread("./a.png")
gray = cv2.cvtColor(img, cv2.COLOR_BGR2GRAY)

ret, thr = cv2.threshold(gray, 127, 255, cv2.THRESH_OTSU)
_, contours, _ = cv2.findContours(thr, cv2.RETR_TREE, cv2.CHAIN_APPROX_SIMPLE)
small_cnts = [i for i in contours if cv2.contourArea(i) < 100]
cv2.fillPoly(thr, small_cnts, 0)
_, cnts, _ = cv2.findContours(thr, cv2.RETR_TREE, cv2.CHAIN_APPROX_SIMPLE)

cnts = sorted(cnts, key=lambda x: cv2.contourArea(x))

cnts.pop()

img_cp = img.copy()

[cv2.drawContours(img_cp, contours, i, (255, 0, 0), thickness=3) for i in range(len(contours))]

plt.imshow(cv2.cvtColor(img_cp, cv2.COLOR_BGR2RGB))

plt.show()

cnt_0 = cnts[0]
cnt_1 = cnts[1]

rect_0 = cv2.minAreaRect(cnt_0)
rect_1 = cv2.minAreaRect(cnt_1)

box_0 = cv2.boxPoints(rect_0).astype(np.int0)

box_1 = cv2.boxPoints(rect_1).astype(np.int0)

cv2.drawContours(img_cp, [box_0], 0, (0, 255, 0), 5)

_ = cv2.drawContours(img_cp, [box_1], 0, (0, 255, 0), 5)

plt.imshow(cv2.cvtColor(img_cp, cv2.COLOR_BGR2RGB))

plt.show()

# get the 2 points at two shortest borders
p = box_0[0]
min_dist = 100000
min_idx = -1
for i in range(1, box_0.shape[0]):
    if (box_0[i][0] - p[0])**2 + (box_0[i][1] - p[1])**2 < min_dist:
        min_idx = i
        min_dist = (box_0[i][0] - p[0])**2 + (box_0[i][1] - p[1])**2

cen_0 = [np.mean((box_0[min_idx][0], p[0])), np.mean((box_0[min_idx][1], p[1]))]
t_lst = list(range(4))
t_lst.remove(0)
t_lst.remove(min_idx)
cen_1 = [np.mean((box_0[t_lst[0]][0], box_0[t_lst[1]][0])), np.mean((box_0[t_lst[0]][1], box_0[t_lst[1]][1]))]

# Then we get the main direction
if not cen_1[0] - cen_0[0]:
    slope = 0
else:
    main_direction = (cen_1[1] - cen_0[1]) / (cen_1[0] - cen_0[0])
    if not cen_1[1] - cen_0[1]:
        # slope doesn't exist
        pass
    else:
        slope = 1/main_direction

# get sec_max_point
max_dist = 0
max_idx = -1
for i in range(1, box_0.shape[0]):
    if (box_0[i][0] - p[0])**2 + (box_0[i][1] - p[1])**2 > max_dist:
        max_idx = i
        max_dist = (box_0[i][0] - p[0])**2 + (box_0[i][1] - p[1])**2
sec_max_dist = 0
sec_max_idx = -1
tt_lst = list(range(4))
for i in range(1, box_0.shape[0]):
    if i == max_idx:
        continue
    if (box_0[i][0] - p[0])**2 + (box_0[i][1] - p[1])**2 > sec_max_dist:
        sec_max_idx = i
        sec_max_dist = (box_0[i][0] - p[0])**2 + (box_0[i][1] - p[1])**2
tt_lst.remove(0)
tt_lst.remove(sec_max_idx)

# draw cross lines
line1_points = [box_0[0], box_0[sec_max_idx]]
line1_middle = [int(np.mean((line1_points[0][0], line1_points[1][0]))),
                int(np.mean((line1_points[0][1], line1_points[1][1])))]
line2_points = [box_0[tt_lst[0]], box_0[tt_lst[1]]]
line2_middle = [int(np.mean((line2_points[0][0], line2_points[1][0]))),
                int(np.mean((line2_points[0][1], line2_points[1][1])))]
point_middle_1 = [line1_middle, line2_middle]
img_cp = cv2.line(img_cp, tuple(point_middle_1[0]), tuple(point_middle_1[1]), (0, 255, 0), 3)

for i in point_middle_1:
    cv2.circle(img_cp, tuple(i), 3, (0, 0, 255), thickness=3)
plt.imshow(cv2.cvtColor(img_cp, cv2.COLOR_BGR2RGB))
plt.show()
| | 2 | No.2 Revision |
Hi, I've drawn one line in my poor code T_T, but I don't have time now to transform it into the iterative one: draw parallel lines along the shorter side to divide the rect into 2, 4, 8, ... parts, hope this can help you a bit:)
I'll try to spare time to turn it into a iterative one.
import cv2
import numpy as np
import matplotlib.pyplot as plt


img = cv2.imread("./a.png")
gray = cv2.cvtColor(img, cv2.COLOR_BGR2GRAY)

ret, thr = cv2.threshold(gray, 127, 255, cv2.THRESH_OTSU)
_, contours, _ = cv2.findContours(thr, cv2.RETR_TREE, cv2.CHAIN_APPROX_SIMPLE)
small_cnts = [i for i in contours if cv2.contourArea(i) < 100]
cv2.fillPoly(thr, small_cnts, 0)
_, cnts, _ = cv2.findContours(thr, cv2.RETR_TREE, cv2.CHAIN_APPROX_SIMPLE)
 cnts = sorted(cnts, key=lambda x: cv2.contourArea(x))
 cnts.pop()

img_cp = img.copy()
 [cv2.drawContours(img_cp, contours, i, (255, 0, 0), thickness=3) for i in range(len(contours))]
 plt.imshow(cv2.cvtColor(img_cp, cv2.COLOR_BGR2RGB))
 plt.show()

cnt_0 = cnts[0]
cnt_1 = cnts[1]
 rect_0 = cv2.minAreaRect(cnt_0)
rect_1 = cv2.minAreaRect(cnt_1)
 box_0 = cv2.boxPoints(rect_0).astype(np.int0)
 box_1 = cv2.boxPoints(rect_1).astype(np.int0)
 cv2.drawContours(img_cp, [box_0], 0, (0, 255, 0), 5)
 _ = cv2.drawContours(img_cp, [box_1], 0, (0, 255, 0), 5)
 plt.imshow(cv2.cvtColor(img_cp, cv2.COLOR_BGR2RGB))
 plt.show()

# get the 2 points at two shortest borders
p = box_0[0]
min_dist = 100000
min_idx = -1
for i in range(1, box_0.shape[0]):
    if (box_0[i][0] - p[0])**2 + (box_0[i][1] - p[1])**2 < min_dist:
        min_idx = i
        min_dist = (box_0[i][0] - p[0])**2 + (box_0[i][1] - p[1])**2

cen_0 = [np.mean((box_0[min_idx][0], p[0])), np.mean((box_0[min_idx][1], p[1]))]
t_lst = list(range(4))
t_lst.remove(0)
t_lst.remove(min_idx)
cen_1 = [np.mean((box_0[t_lst[0]][0], box_0[t_lst[1]][0])), np.mean((box_0[t_lst[0]][1], box_0[t_lst[1]][1]))]

# Then we get the main direction
if not cen_1[0] - cen_0[0]:
    slope = 0
else:
    main_direction = (cen_1[1] - cen_0[1]) / (cen_1[0] - cen_0[0])
    if not cen_1[1] - cen_0[1]:
        # slope doesn't exist
        pass
    else:
        slope = 1/main_direction

# get sec_max_point
max_dist = 0
max_idx = -1
for i in range(1, box_0.shape[0]):
    if (box_0[i][0] - p[0])**2 + (box_0[i][1] - p[1])**2 > max_dist:
        max_idx = i
        max_dist = (box_0[i][0] - p[0])**2 + (box_0[i][1] - p[1])**2
sec_max_dist = 0
sec_max_idx = -1
tt_lst = list(range(4))
for i in range(1, box_0.shape[0]):
    if i == max_idx:
        continue
    if (box_0[i][0] - p[0])**2 + (box_0[i][1] - p[1])**2 > sec_max_dist:
        sec_max_idx = i
        sec_max_dist = (box_0[i][0] - p[0])**2 + (box_0[i][1] - p[1])**2
tt_lst.remove(0)
tt_lst.remove(sec_max_idx)

# draw cross lines
line1_points = [box_0[0], box_0[sec_max_idx]]
line1_middle = [int(np.mean((line1_points[0][0], line1_points[1][0]))),
                int(np.mean((line1_points[0][1], line1_points[1][1])))]
line2_points = [box_0[tt_lst[0]], box_0[tt_lst[1]]]
line2_middle = [int(np.mean((line2_points[0][0], line2_points[1][0]))),
                int(np.mean((line2_points[0][1], line2_points[1][1])))]
point_middle_1 = [line1_middle, line2_middle]
img_cp = cv2.line(img_cp, tuple(point_middle_1[0]), tuple(point_middle_1[1]), (0, 255, 0), 3)

for i in point_middle_1:
    cv2.circle(img_cp, tuple(i), 3, (0, 0, 255), thickness=3)
plt.imshow(cv2.cvtColor(img_cp, cv2.COLOR_BGR2RGB))
plt.show()
| | 3 | No.3 Revision |
Hi, I've drawn one line in my poor code T_T, but I don't have time now to transform it into the iterative one: draw parallel lines along the shorter side to divide the rect into 2, 4, 8, ... parts, hope this can help you a bit:)
I'll try to spare time to turn it into a iterative one.
import cv2
import numpy as np
import matplotlib.pyplot as plt


img = cv2.imread("./a.png")
gray = cv2.cvtColor(img, cv2.COLOR_BGR2GRAY)

ret, thr = cv2.threshold(gray, 127, 255, cv2.THRESH_OTSU)
_, contours, _ = cv2.findContours(thr, cv2.RETR_TREE, cv2.CHAIN_APPROX_SIMPLE)
small_cnts = [i for i in contours if cv2.contourArea(i) < 100]
cv2.fillPoly(thr, small_cnts, 0)
_, cnts, _ = cv2.findContours(thr, cv2.RETR_TREE, cv2.CHAIN_APPROX_SIMPLE)
cnts = sorted(cnts, key=lambda x: cv2.contourArea(x))
cnts.pop()

img_cp = img.copy()
[cv2.drawContours(img_cp, contours, i, (255, 0, 0), thickness=3) for i in range(len(contours))]
plt.imshow(cv2.cvtColor(img_cp, cv2.COLOR_BGR2RGB))
plt.show()

cnt_0 = cnts[0]
cnt_1 = cnts[1]
rect_0 = cv2.minAreaRect(cnt_0)
rect_1 = cv2.minAreaRect(cnt_1)
box_0 = cv2.boxPoints(rect_0).astype(np.int0)
box_1 = cv2.boxPoints(rect_1).astype(np.int0)
cv2.drawContours(img_cp, [box_0], 0, (0, 255, 0), 5)
_ = cv2.drawContours(img_cp, [box_1], 0, (0, 255, 0), 5)
plt.imshow(cv2.cvtColor(img_cp, cv2.COLOR_BGR2RGB))
plt.show()

# get the 2 points at two shortest borders
p = box_0[0]
min_dist = 100000
min_idx = -1
for i in range(1, box_0.shape[0]):
    if (box_0[i][0] - p[0])**2 + (box_0[i][1] - p[1])**2 < min_dist:
        min_idx = i
        min_dist = (box_0[i][0] - p[0])**2 + (box_0[i][1] - p[1])**2

cen_0 = [np.mean((box_0[min_idx][0], p[0])), np.mean((box_0[min_idx][1], p[1]))]
t_lst = list(range(4))
t_lst.remove(0)
t_lst.remove(min_idx)
cen_1 = [np.mean((box_0[t_lst[0]][0], box_0[t_lst[1]][0])), np.mean((box_0[t_lst[0]][1], box_0[t_lst[1]][1]))]

# Then we get the main direction
if not cen_1[0] - cen_0[0]:
    slope = 0
else:
    main_direction = (cen_1[1] - cen_0[1]) / (cen_1[0] - cen_0[0])
    if not cen_1[1] - cen_0[1]:
        # slope doesn't exist
        pass
    else:
        slope = 1/main_direction

# get sec_max_point
max_dist = 0
max_idx = -1
for i in range(1, box_0.shape[0]):
    if (box_0[i][0] - p[0])**2 + (box_0[i][1] - p[1])**2 > max_dist:
        max_idx = i
        max_dist = (box_0[i][0] - p[0])**2 + (box_0[i][1] - p[1])**2
sec_max_dist = 0
sec_max_idx = -1
tt_lst = list(range(4))
for i in range(1, box_0.shape[0]):
    if i == max_idx:
        continue
    if (box_0[i][0] - p[0])**2 + (box_0[i][1] - p[1])**2 > sec_max_dist:
        sec_max_idx = i
        sec_max_dist = (box_0[i][0] - p[0])**2 + (box_0[i][1] - p[1])**2
tt_lst.remove(0)
tt_lst.remove(sec_max_idx)

# draw cross lines
line1_points = [box_0[0], box_0[sec_max_idx]]
line1_middle = [int(np.mean((line1_points[0][0], line1_points[1][0]))),
                int(np.mean((line1_points[0][1], line1_points[1][1])))]
line2_points = [box_0[tt_lst[0]], box_0[tt_lst[1]]]
line2_middle = [int(np.mean((line2_points[0][0], line2_points[1][0]))),
                int(np.mean((line2_points[0][1], line2_points[1][1])))]
point_middle_1 = [line1_middle, line2_middle]
img_cp = cv2.line(img_cp, tuple(point_middle_1[0]), tuple(point_middle_1[1]), (0, 255, 0), 3)

for i in point_middle_1:
    cv2.circle(img_cp, tuple(i), 3, (0, 0, 255), thickness=3)
plt.imshow(cv2.cvtColor(img_cp, cv2.COLOR_BGR2RGB))
plt.show()
