This forum is disabled, please visit https://forum.opencv.org
| | 1 | initial version |
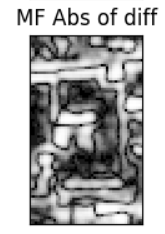
You can try use the opencv python code I made public in my linkedin article https://www.linkedin.com/pulse/new-approach-visualizing-gradient-variations-images-marc-fiammante/ Here is what I get with your image
| | 2 | No.2 Revision |
You can try use the opencv python code I made public in code
blur = cv2.blur(img,(9,9)) blur2 = cv2.GaussianBlur(img,(3,3),0)
absd=cv2.equalizeHist(cv2.cvtColor(cv2.absdiff(blur2,blur),cv2.COLOR_BGR2GRAY))
The first blur gives long range variations the second blur gives short range variations
The absolute difference gets the gradient and if an object is half shaded invert the part under shade. The histogram equalization restores a gray scale range for visualisation.
In my linkedin article https://www.linkedin.com/pulse/new-approach-visualizing-gradient-variations-images-marc-fiammante/
Here is what I get with your imagetest the one which gave me the best results for visualizing edges
| | 3 | No.3 Revision |
You can try use the opencv python code
absd=cv2.equalizeHist(cv2.cvtColor(cv2.absdiff(blur2,blur),cv2.COLOR_BGR2GRAY))
The first blur gives long range variations the second blur gives short range variations
The absolute difference gets the gradient and if an object is half shaded invert the part under shade. The histogram equalization restores a gray scale range for visualisation.
In my test the one which gave me the best results for visualizing edges