This forum is disabled, please visit https://forum.opencv.org
| 2021-06-15 22:22:18 -0600 | received badge | ● Popular Question (source) |
| 2020-12-09 08:46:43 -0600 | received badge | ● Nice Answer (source) |
| 2020-12-06 05:06:14 -0600 | received badge | ● Popular Question (source) |
| 2020-10-30 08:55:44 -0600 | received badge | ● Popular Question (source) |
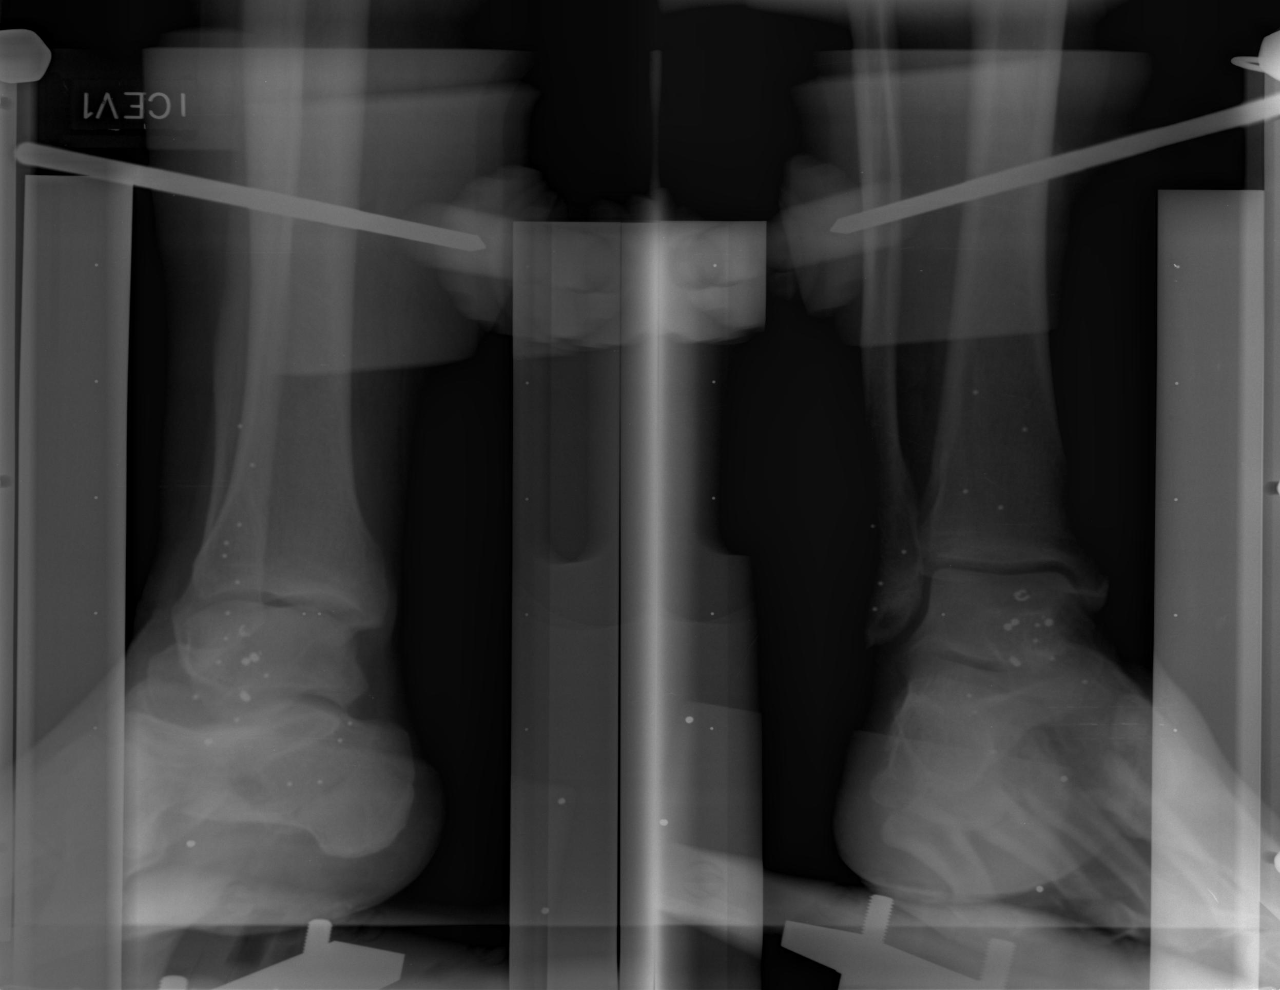
| 2020-10-28 04:26:36 -0600 | marked best answer | some brainstorming help to detect speckles I am trying the make the life of one of my friends easier regarding to the project that he is working. He has a bunch of images like this one:
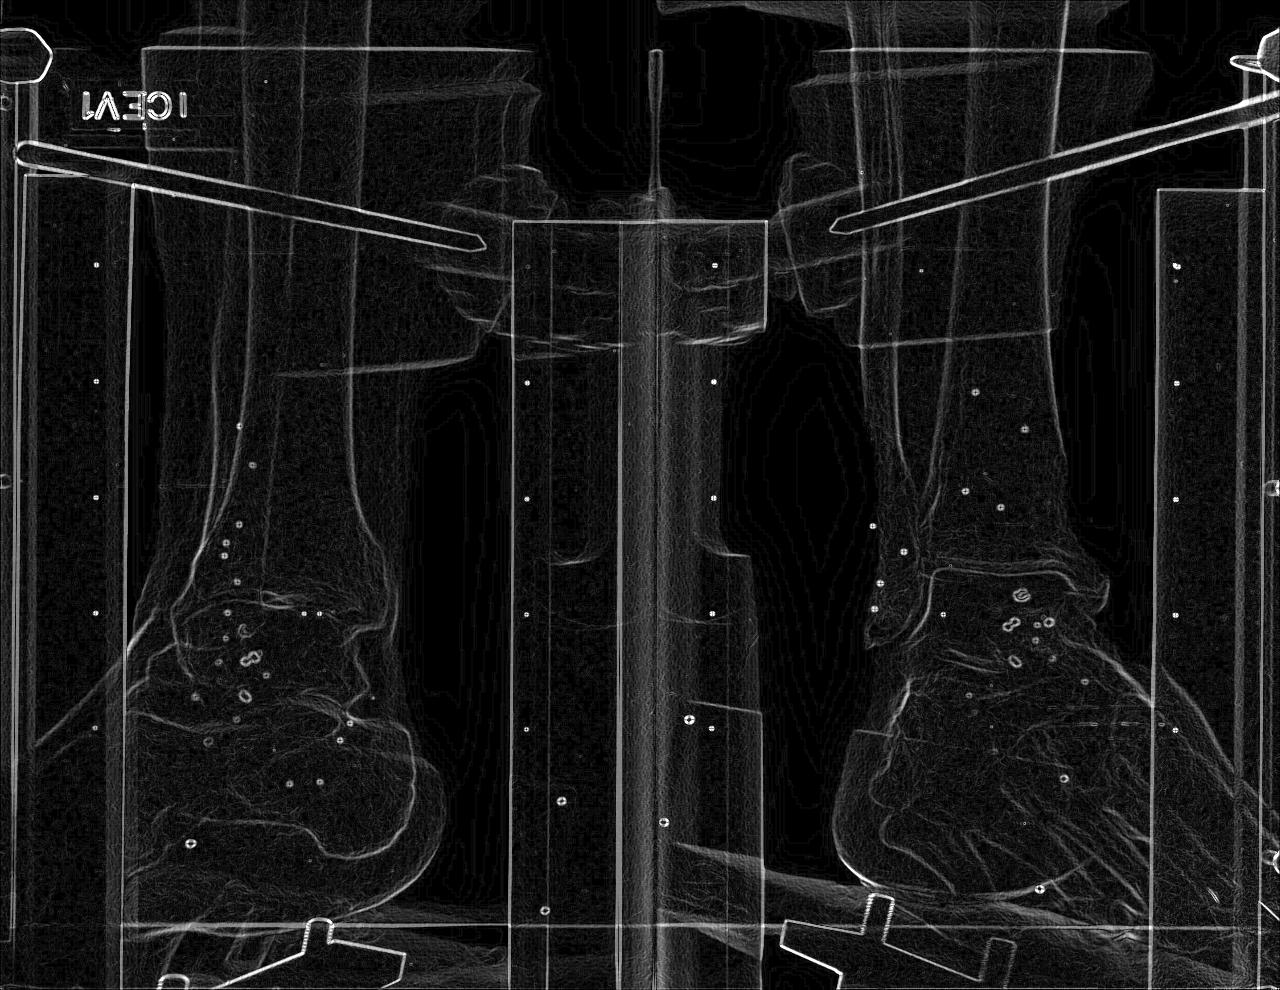
and the purpose is to extract the white dots. I tried different kind of filters, and the best that I managed to get was by using Scharr:
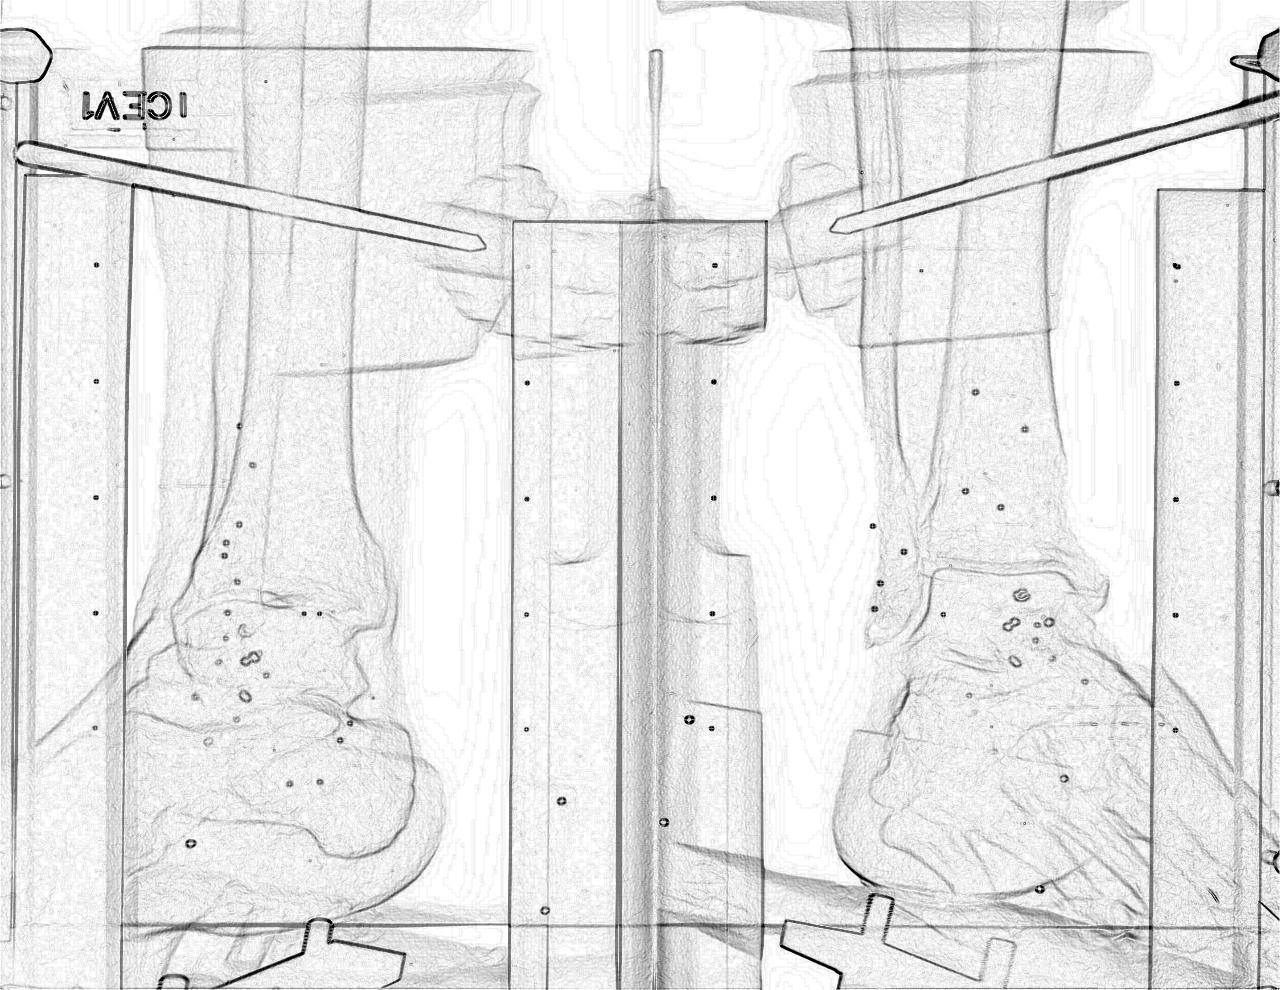
and the bitwise_nor version of it:
now I the problem is that some dots are not that acute so if I apply threshold I erase quite some of them or I am not able to extract all of them. I tried to segment the image into blocks and apply different threshold to each of the blocks and then recreate the image but the result is not that good as well (actually worse). As I can see the main problem is the noise in-between. If you can think something that might help to eliminate this noise, I would be grateful. It seems so easy, but for some reason I am stuck. |
| 2020-10-28 04:26:31 -0600 | received badge | ● Nice Question (source) |
| 2020-09-28 16:49:01 -0600 | received badge | ● Popular Question (source) |
| 2020-09-22 05:22:30 -0600 | received badge | ● Famous Question (source) |
| 2020-05-06 16:06:54 -0600 | received badge | ● Notable Question (source) |
| 2020-02-25 09:17:50 -0600 | received badge | ● Popular Question (source) |
| 2020-01-17 03:39:47 -0600 | received badge | ● Great Question (source) |
| 2019-11-15 01:41:18 -0600 | received badge | ● Favorite Question (source) |
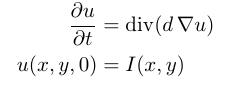
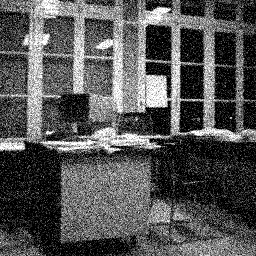
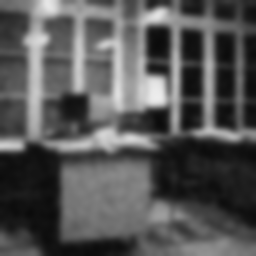
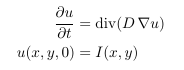
| 2019-10-18 23:12:56 -0600 | marked best answer | isotropic linear diffusion smoothing I want to apply the denoising filter I named in the title which is based on the following equations:
where Here is a sample image:
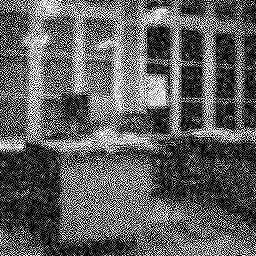
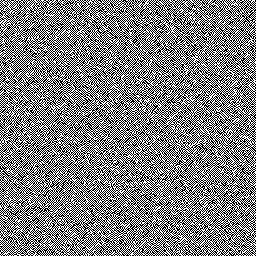
UPDATEthis is the result images after following @LBerger 's code, they are in time
, is it expected to be like that? I think that something is wrong, because I am trying also to compare it with the gaussian smoothing. And according to the following formula:
where and applying the gaussian filter with the following code: and calling it with
which are for sure not similar :-(. |
| 2019-08-12 06:23:28 -0600 | received badge | ● Notable Question (source) |
| 2019-05-13 12:29:55 -0600 | received badge | ● Notable Question (source) |
| 2019-02-25 09:31:35 -0600 | received badge | ● Popular Question (source) |
| 2018-12-29 17:03:46 -0600 | received badge | ● Notable Question (source) |
| 2018-12-11 04:09:37 -0600 | received badge | ● Guru (source) |
| 2018-12-11 04:09:33 -0600 | received badge | ● Great Answer (source) |
| 2018-11-26 15:06:24 -0600 | received badge | ● Notable Question (source) |
| 2018-10-03 05:59:36 -0600 | received badge | ● Popular Question (source) |
| 2018-09-12 02:19:45 -0600 | received badge | ● Notable Question (source) |
| 2018-08-06 00:21:39 -0600 | received badge | ● Popular Question (source) |
| 2018-07-10 05:47:46 -0600 | received badge | ● Popular Question (source) |
| 2018-06-20 08:14:07 -0600 | received badge | ● Popular Question (source) |
| 2018-06-08 02:33:01 -0600 | received badge | ● Famous Question (source) |
| 2018-05-31 11:05:39 -0600 | received badge | ● Famous Question (source) |
| 2018-04-07 16:32:51 -0600 | commented answer | how do you plot graphs in opencv projects? really impressive work!!! nice :-) |
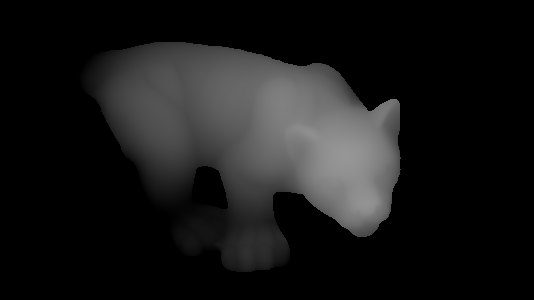
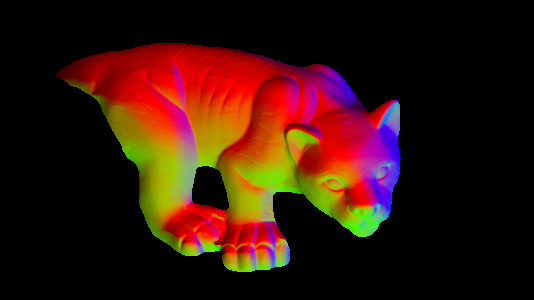
| 2018-02-22 09:01:21 -0600 | marked best answer | Calculate surface normals from depth image using neighboring pixels cross product As the title says I want to calculate the surface normals of a given depth image by using the cross product of neighboring pixels. However, I do not really understand the procedure. Does anyone have any experience? Lets say that we have the following image:
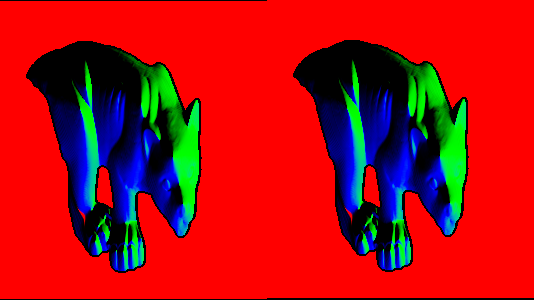
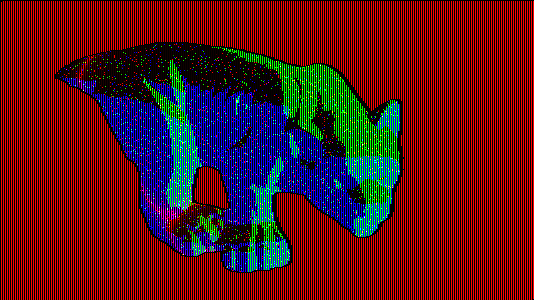
what are the steps to follow? Update: I am trying to translate the following pseudocode from this answer to opencv. where z(x,y) is my depth image. However, the output of the following does not seem correct to me: Update2: Ok I think I am close: which gives me the following image:
Update 3: following @berak's approach: I get this one:
which seems quite ok. However, if I use a 32bit image instead of 64bit the image is corrupted:
|
| 2017-12-14 08:53:54 -0600 | received badge | ● Famous Question (source) |
| 2017-11-22 08:40:47 -0600 | received badge | ● Popular Question (source) |
| 2017-11-13 16:51:42 -0600 | marked best answer | how do you plot graphs in opencv projects? Hey guys, I was just wondering, there are cases where sometimes you need to plot a graph in real time within a project in order to keep track or evaluate data or for any other possible reason. At the moment OpenCV does not support such a functionality - right? please correct me if I am wrong here, maybe the 3.x version introduced something that I am not aware - and from a thorough search that I did I only found this two libraries, [1] and [2] that somehow try to simulate such a wanna be plotting functionality with the use of OpenCV. However though I appreciate the effort of their authors, both are quite old, meaning they are using the old C api and for sure they are not something close to functional, like matlab, gnuplot, etc... So, here comes my question how do you guys do it? I was looking also at QWT and some examples but it does not seem that convenient regarding also that you need to include My wonder was that OpenCV as a mature and really known library in computer vision and image processing fields should have such a functionality or to embed it from another external library which is specifically for that reason, since I thing such a functionality is quite some times necessary. Moreover, I was also thinking on starting something from scratch based on the first two libraries that I pointed here, but I am not that confident that I would be able to provide a solution and reach it in such a level that I would be also able to contribute it to the main OpenCV's source code. So if someone is interested we could also arrange a group that will start such a task in our spare time and when we reach it in a good level to contribute it to OpenCV. So I would like to hear your opinions and why not enlighten and advice me, regarding what you are using or how you do it in general or if you are interested to create something together if there is a need about it. Be aware though that I am not talking about offline plotting since this is quite easy to manage and there are a lot of tools out there that make the drill in more than a perfect way ;-). |
| 2017-09-23 01:13:32 -0600 | received badge | ● Notable Question (source) |
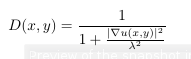
| 2017-09-14 13:38:59 -0600 | marked best answer | isotropic non-linear diffusion smoothing (Perona-Malik) Now in addition to the my previous thread regarding isotropic linear diffusion smoothing, I want to solve the non-linear version of it based on the Perona-Malik approach. Again we have the following formula:
, where
where However, while I am trying to use it regarding to what @LBerger came up in the other thread I cannot get the correct output. What do I miss again? I see that the author apply some scalar non-linear diffusion step functionality which I do not really understand what it is about it, here is the function. I tried what @Guanta suggested in the other thread
but it did not give a good output :-(. |
| 2017-09-06 09:57:10 -0600 | received badge | ● Popular Question (source) |
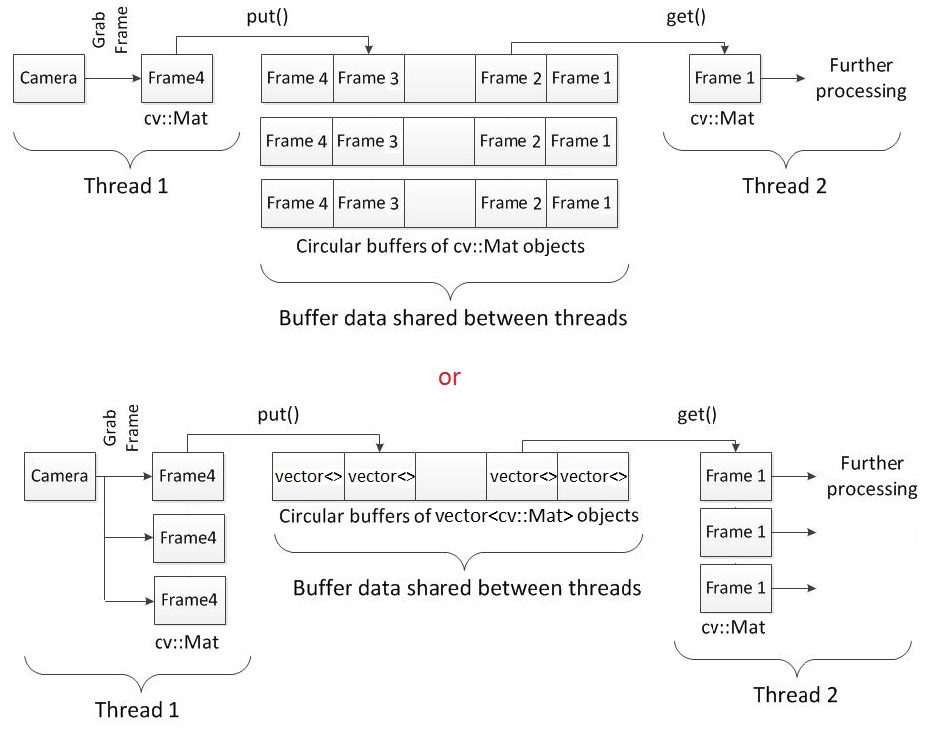
| 2017-09-04 13:17:10 -0600 | marked best answer | grab and process multiple frames in different threads - opencv semi-related Well as the title says I would like to grab and process multiple frames in different threads by using a circular buffer or more, I hope that you can point me to what is better. For grabbing frames I am not using the
At the moment I am using the second approach with the vector and adapting @pklab 's approach from the first link I posted above. Code is below: |
| 2017-08-24 02:33:31 -0600 | received badge | ● Nice Answer (source) |

 (1)
(1) (2)
(2)