Amplitude of signal

Hi, from maybe a month I'm working on my bachelor thesis, that is based on OpenCV. But now I have one problem...
So here you can see that continuous function. From that 2d image I have to extract the amplitude of that function, but the problem is that there is some noise on the function it self ant in the area around it (lower part of the image).
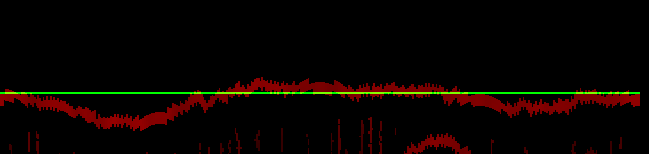
So now the question is how to get the amplitude of that kind of signal ? I thought about median filtering or erosion/dilatation but I'm afraid, that with the erosion on some places I can destroy the function it self...
p.p
The signal that you are drawing, how is it stored an/or measured? Isn't there another part of the code where you may apply the filter? and by the way, what is the signal that is similar to the signal line in the bottom of the image? Is it noise? I think that that one needs a special treatment, no?
You could start by trying to seperate both signals and classify them seperately. How about
Now for each column you can
This allows you to seperate the noise by masking and to only keep the signal. Then the hardest part comes with finding the amplitude. No idea there yet.
For better help I think he could inform us of what is he displaying: the amplitude (this is what it seems to me)? What is the green line? :)
I guess he has the amplitude visualized on a time basis and with the green line being the origin.
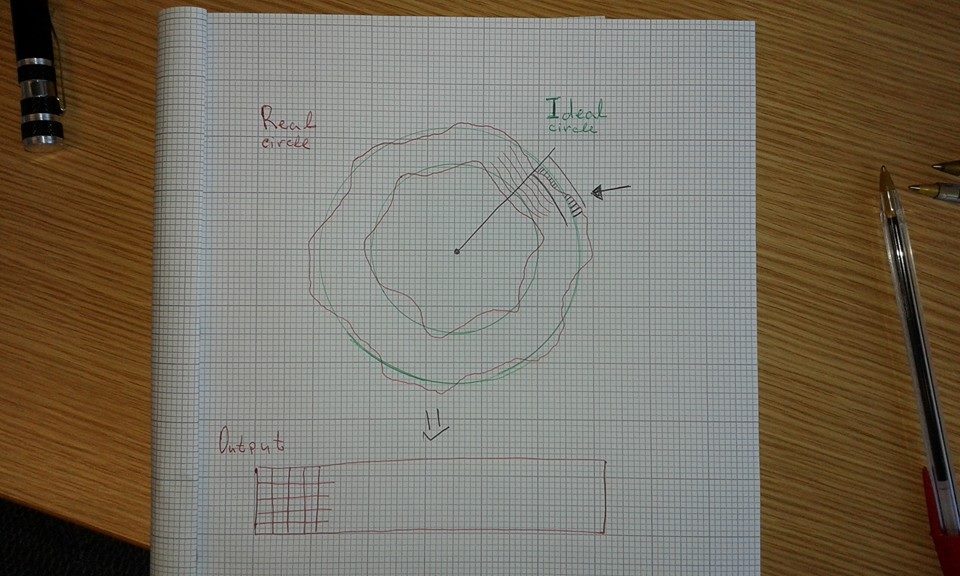
Basically I have 2 ideal circles detected with hough and 2 real edge maps. Ana I want to find the difference between them. After that I will use that information to "unroll" the image between the real circles to cartesian coordinate system.