Ask Your Question
2

Accessing pixels along a circle

asked 2014-01-23 07:16:02 -0600

John_E gravatar image

updated 2015-09-02 14:26:33 -0600

Hi!

Got an annoying problem.

I have:

  • A binary image containing the result of a canny edge detection.
  • A Vector containing all points on a circle.

I want:

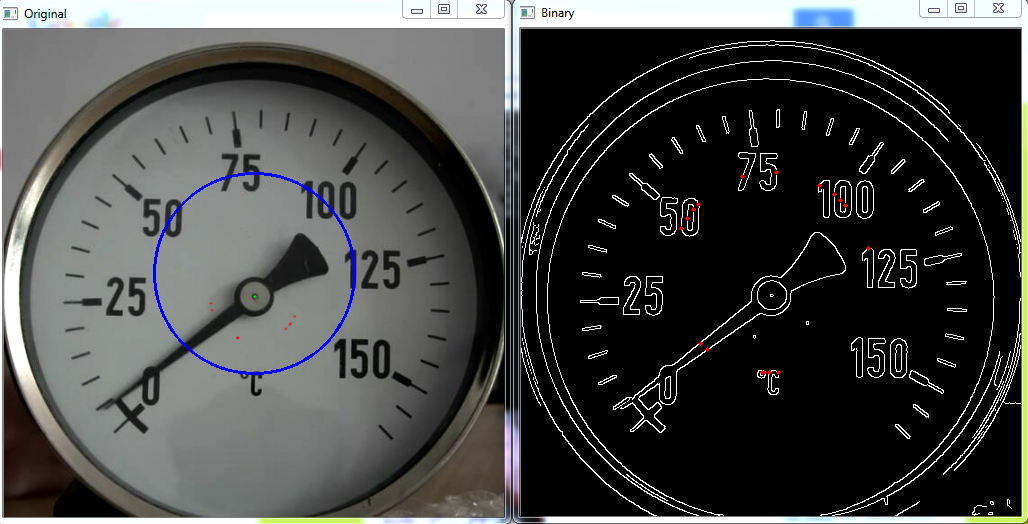
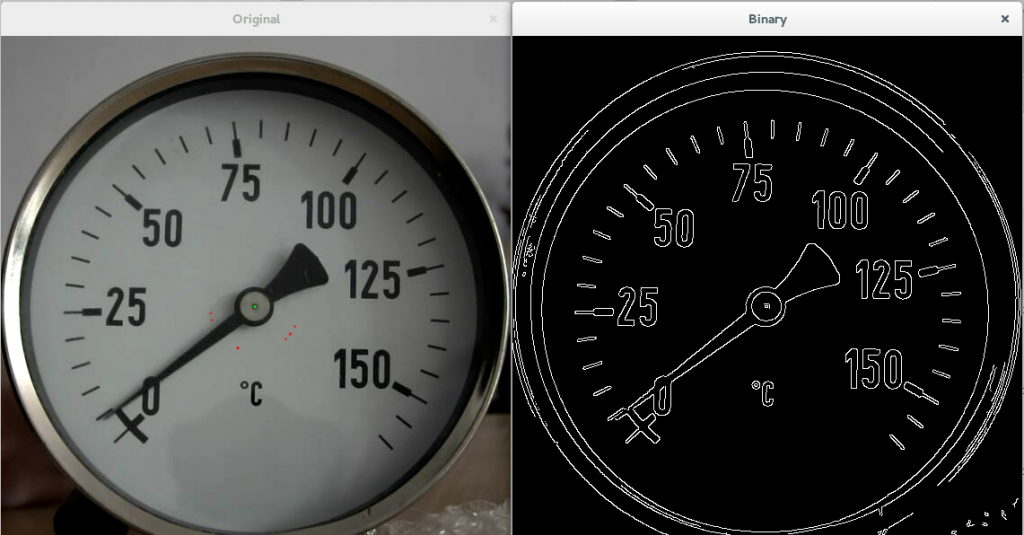
To draw a little dot on all points where the circle intersects a white line on the canny image.

The problem:

I can use the points with draw functions such as circle(). But when I use them with Mat::at() I end up accessing pixels outside the image. It is as if I need to translate the points before using at. But to what? image description

The code:

#include <iostream>
#include <iomanip>
#include <sstream>
#include <opencv2/highgui/highgui.hpp>
#include <opencv2/imgproc/imgproc.hpp>

#define NEEDLE_CENTER_X 565
#define NEEDLE_CENTER_Y 602
#define I_CIRCLE_RADIUS 100
#define CANNY_THRESHOLD 70

using namespace std;
using namespace cv;

int main()
{
    namedWindow( "Original", CV_WINDOW_AUTOSIZE );
    namedWindow( "Binary", CV_WINDOW_AUTOSIZE );
    moveWindow( "Binary", 570, 100 );
    moveWindow( "Original", 0, 100 );

    Point needle_center( NEEDLE_CENTER_X, NEEDLE_CENTER_Y );

    //Get points in circle
    Size axes( I_CIRCLE_RADIUS, I_CIRCLE_RADIUS );
    vector<Point> circle_points;
    ellipse2Poly( needle_center, axes, 0, 0, 360, 1, circle_points );

    //Step through images
    for( int i = 1; i <= 21; i++ )
    {
        stringstream file;
        file << "img/" << setw( 2 ) << setfill( '0' ) << i << ".png";

        //Read image
        Mat original = imread( file.str(), CV_LOAD_IMAGE_UNCHANGED );
        circle( original, needle_center, 2, CV_RGB( 0, 255, 0 ), 1, CV_AA, 1 );

        //Make a grayscale copy
        Mat gray( original.size(), CV_8UC1 );
        cvtColor( original, gray, CV_BGR2GRAY );

        //Find edges in grayscale image
        Mat edges( original.size(), CV_8UC1 );
        Canny( gray, edges, CANNY_THRESHOLD, CANNY_THRESHOLD * 3, 3 );

        //Iterate pixels in circle
        for( auto current_point : circle_points )
        {
            if( (edges.at<uchar>( current_point )) != 0 )
                circle( original, current_point, 1, CV_RGB( 255, 0, 0 ), 1, CV_AA, 1 );
        }

        imshow( "Binary", edges );
        imshow( "Original", original );

        if( (waitKey( 0 )) == 1048603 )
            break;
    }

    destroyAllWindows();

    return 0;
}

Any help is appreciated.

//John

edit retag flag offensive close merge delete

2 answers

Sort by ยป oldest newest most voted
9

answered 2014-01-23 08:52:31 -0600

updated 2014-01-24 06:51:05 -0600

Actually I think that there is a smarter way of retrieving the points on a given circle using the ellipse2Poly functionality. Then it is basically looping through all points in the resulting point vector and matching them with edge pixel locations that have white values.

Point circle_center (x,y);
Size axes (10,10); // Ellipse axis dimensions, divided by 2, here the diameter will be 20 pixels
vector<Point>& points_on_circle;
ellipse2Poly(circle_center, axes, 0, 0, 360, 1, points_on_circle);

This will result in 360 points that can be matched.

ADDITION 1:

Can you try this for matching the points in edges and i_points?

for(int i = 0; i < i_points.size(); i++){
    Point current_point = i_points[i];
    if ( edges.at<uchar>(i_points[i].x, i_points[i].y) == 1 ){
         circle( original, i_point, 1, CV_RGB( 255, 0, 0 ), -1); // filled circle at the position
    }
}

SOLUTION

After some digging, i found a solution for this. Single circle, focussed around the center of the image for now, looks for intersecting points with the points on the circle and visualises them.

An image to prove that this works (ignore the red dots in the original, had to grab your visualisation for tryout):

image description

And the code used for this.

#include <iostream>
#include <opencv2/highgui/highgui.hpp>
#include <opencv2/imgproc/imgproc.hpp>

#define I_CIRCLE_RADIUS 100
#define CANNY_THRESHOLD 70

using namespace std;
using namespace cv;

int main()
{
    namedWindow( "Original", CV_WINDOW_AUTOSIZE );
    namedWindow( "Binary", CV_WINDOW_AUTOSIZE );
    moveWindow( "Binary", 570, 100 );
    moveWindow( "Original", 0, 100 );

    // Read image
    Mat original = imread( "c:/data/test.png" );

    // Define circle center
    // put the circle center at the center of image for test purposes
    // Scalar is the way to go CV_RGB is old format, openCV uses Scalar on BGR now
    Point circle_center( original.cols/2, original.rows/2 ); 

    // Calculate all points on that circle
    // Axes are half of the ellipse axes, a circle is a perfect ellipse, with radius = 2x half of the axes :)
    Size axes( I_CIRCLE_RADIUS, I_CIRCLE_RADIUS );
    vector<Point> circle_points;
    ellipse2Poly( circle_center, axes, 0, 0, 360, 1, circle_points );

    //Make a grayscale copy
    Mat gray( original.size(), CV_8UC1 );
    cvtColor( original, gray, CV_BGR2GRAY );

    //Find edges in grayscale image
    Mat edges( original.size(), CV_8UC1 );
    Canny( gray, edges, CANNY_THRESHOLD, CANNY_THRESHOLD * 3, 3 );

    // Only draw extra info right before visualisation
    circle( original, circle_center, I_CIRCLE_RADIUS, Scalar( 255, 0, 0 ), 2);

    // Lets make a edge map on a 3 channel color image for output purposes
    Mat edges_color(edges.rows, edges.cols, CV_8UC3);
    Mat in[] = { edges, edges, edges };
    int from_to[] = { 0,0, 1,1, 2,2 };
    mixChannels( in, 3, &edges_color, 1, from_to, 3 );

    //Iterate pixels in circle
    for(int i = 0; i < circle_points.size(); i++){
        Point current_point = circle_points[i];
        int value_at_that_location_in_edge_map = edges.at<uchar>(circle_points[i].y, circle_points[i].x);
        cout << value_at_that_location_in_edge_map << " ";
        if ( value_at_that_location_in_edge_map == 255 ){
                circle( edges_color, circle_points[i], 2, Scalar( 0, 0, 255 ), -1); // filled circle at the position
        }
    }

    // Always add a waitKey(5) after an imshow so that the onpaint inner method can get executed without problems
    imshow( "Binary", edges_color ); waitKey(5);
    imshow( "Original", original ); waitKey(5);

    // Wait forever on a hit to close application
    waitKey ...
(more)
edit flag offensive delete link more

Comments

@StevenPuttemans Thanks that is a smarter way of creating the points. Unfortunately the scattering problem remains when checking the pixel values.

John_E gravatar imageJohn_E ( 2014-01-23 09:03:14 -0600 )edit

I guess that with scatter, you mean that the printed pixels are not lying exactly on a circle?

StevenPuttemans gravatar imageStevenPuttemans ( 2014-01-23 09:13:02 -0600 )edit

No. they are on the circle, but not where the circle intersects with the white line.

John_E gravatar imageJohn_E ( 2014-01-23 09:18:43 -0600 )edit

Check my addition. If for each circle position (please output the result image in your question - make circle blue for example and dots red) you check if the edge is white instead of black, then this should work right?

StevenPuttemans gravatar imageStevenPuttemans ( 2014-01-23 09:20:20 -0600 )edit

@StevenPuttemans Nope. It just scatters the points in a different way.

John_E gravatar imageJohn_E ( 2014-01-23 09:31:19 -0600 )edit

Can you please show the result ... I am wondering how your output looks like

StevenPuttemans gravatar imageStevenPuttemans ( 2014-01-23 09:36:23 -0600 )edit

BTW try reversing x and y in my codesnippet of the at operator ... sometimes I am mixing up the rows and cols iterator, which could be damn stupid. I forgot if the at operator thinks in x and y or in rows and cols, which is actually y and x then.

StevenPuttemans gravatar imageStevenPuttemans ( 2014-01-23 09:37:51 -0600 )edit

@StevenPuttemans The picture in the main post shows the result. The dots doesn't move that much as the needle turns.

John_E gravatar imageJohn_E ( 2014-01-23 09:44:25 -0600 )edit
1

@StevenPuttemans I was wrong. Your loop gives the exact same output as mine when accessing it with y, x.

John_E gravatar imageJohn_E ( 2014-01-23 10:02:25 -0600 )edit

I am going to check if I get similar results, let me setup a test project. Will keep you up to date!

StevenPuttemans gravatar imageStevenPuttemans ( 2014-01-24 02:10:24 -0600 )edit
3

answered 2014-01-24 09:35:24 -0600

Goosebumps gravatar image

updated 2014-01-24 10:01:14 -0600

If you want to read out the meter using computer vision you might also consider transforming the image to a polar plot using logpolar.

This might make measuring easier:

image description

Or if it is just the dots, you might even draw them here and transform back to cartesian. Your dots will be slightly deformed though.

edit flag offensive delete link more

Question Tools

Stats

Asked: 2014-01-23 07:16:02 -0600

Seen: 8,843 times

Last updated: Jan 24 '14