Ask Your Question
0

Extract an ellipse form from an image instead of drawing it inside

asked 2013-12-16 11:35:53 -0600

Mark Freewind gravatar image

updated 2020-10-27 09:36:46 -0600

I have a rectangle that I want to extract the ellipse form of it from a given image. My code looks like:

RotatedRect ellipse ;
float p1 = (float) rect.width/2 + rect.x;
float p2 = (float) rect.height/2 + rect.y;
CvPoint2D32f p = cvPoint2D32f(p1,p2);
ellipse.center = p;
ellipse.angle = 0;
ellipse.size =  cvSize2D32f((float)rect.width, (float)rect.height);
ellipse( image_colored, minEllipse, CV_RGB(255,255,255), 2, 8 );

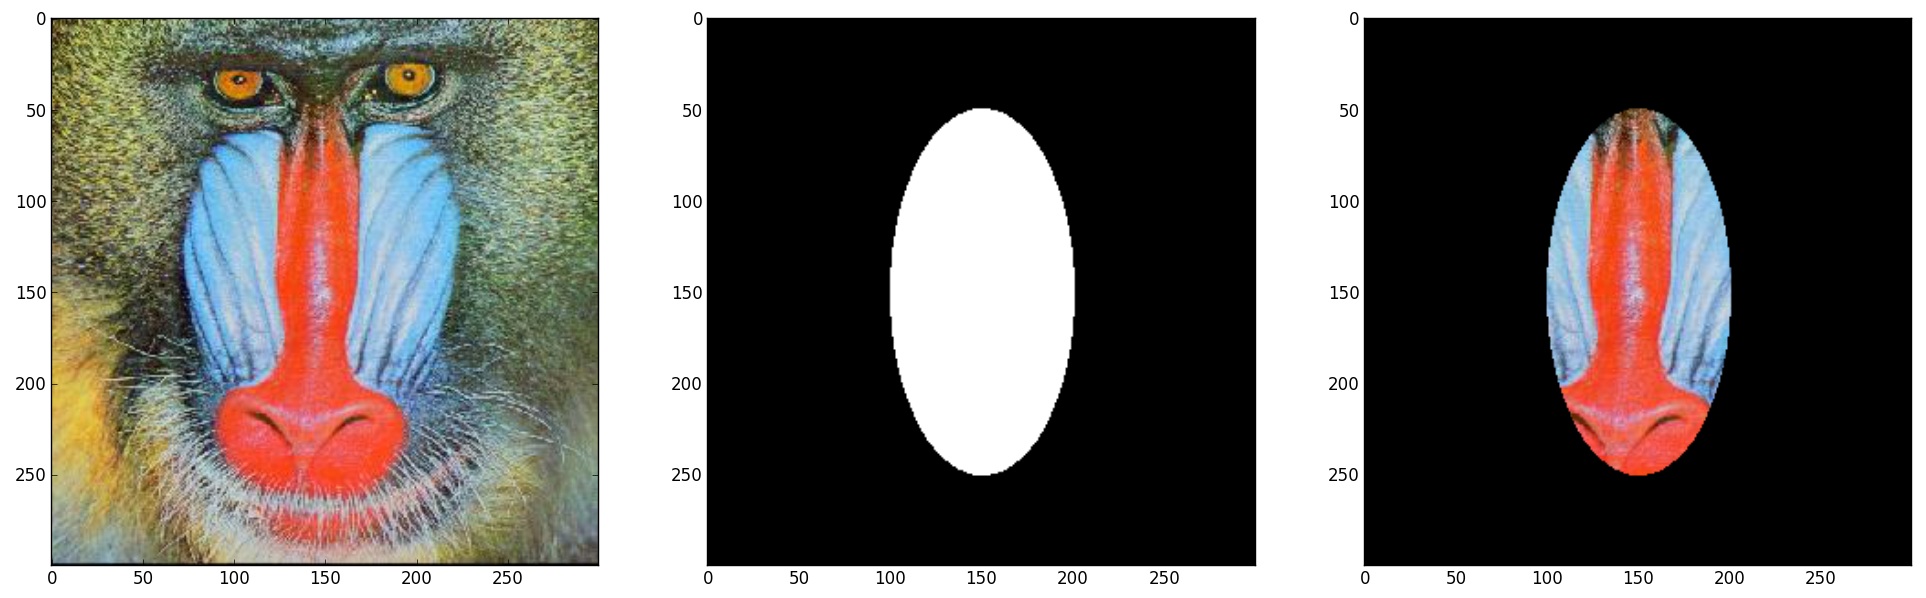
The input of this code are: an image (image_colored) and CvRect (rect). The last line of code, draws a white ellipse inside the "image_colored", but I am looking to extract the generated ellipse in an other image or just color the rest of the image in black.

Any help, will be highly appreciated. Thank you.

edit retag flag offensive close merge delete

1 answer

Sort by ยป oldest newest most voted
3

answered 2013-12-16 23:34:02 -0600

pyro gravatar image

updated 2013-12-16 23:35:01 -0600

There isn't a straightforward way to extract the ellipse. But you may use a mask image to extract the elliptical patch with the rest of the region blacked out.

First, define a mask image which has a white ellipse on a black background. Then use a bitwise and operation to extract the patch.

Python code:

import cv2
import numpy as np
import matplotlib.pyplot as plt

image = cv2.imread('baboon.jpg')
# create a mask image of the same shape as input image, filled with 0s (black color)
mask = np.zeros_like(image)
rows, cols,_ = mask.shape
# create a white filled ellipse
mask=cv2.ellipse(mask, center=(rows/2, cols/2), axes=(50,100), angle=0, startAngle=0, endAngle=360, color=(255,255,255), thickness=-1)
# Bitwise AND operation to black out regions outside the mask
result = np.bitwise_and(image,mask)
# Convert from BGR to RGB for displaying correctly in matplotlib
# Note that you needn't do this for displaying using OpenCV's imshow()
image_rgb = cv2.cvtColor(image, cv2.COLOR_BGR2RGB)
mask_rgb = cv2.cvtColor(mask, cv2.COLOR_BGR2RGB)
result_rgb = cv2.cvtColor(result, cv2.COLOR_BGR2RGB)
# Plotting the results
plt.subplot(131)
plt.imshow(image_rgb)
plt.subplot(132)
plt.imshow(mask_rgb)
plt.subplot(133)
plt.imshow(result_rgb)
plt.show()

Plot:

image description

edit flag offensive delete link more

Question Tools

Stats

Asked: 2013-12-16 11:35:53 -0600

Seen: 9,128 times

Last updated: Dec 16 '13