Ask Your Question
1

merge overlapping rectangles

asked 2018-12-02 01:12:04 -0600

XTSR gravatar image

updated 2018-12-02 09:02:47 -0600

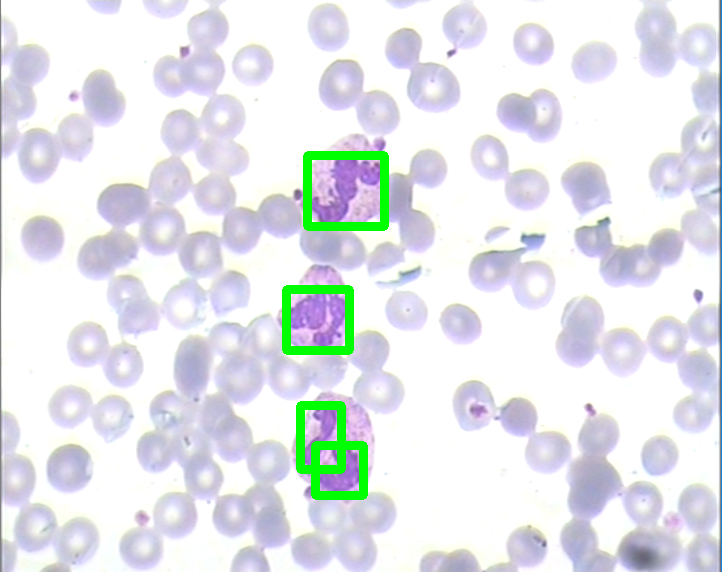
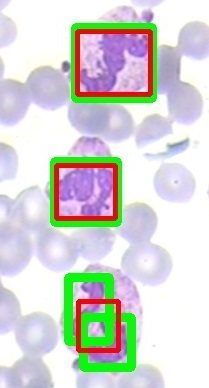
Hello, I am new to OpenCV and I have been trying to detect WBCs. So far, so good but I encountered a problem. There are cells where they are not detected as one and it causes to draw 2 rectangles instead of just one. How can I merge the overlapping rectangles? I found out that OpenCV have a groupRectangles function, can this solve my problem and how do I use it (I can't find an example)? I am using Python 3.7.

Here is the output image of my code: output image of my code

Here is my code:

import cv2
import numpy as np

limit_area = 1000   
x = 0   
y = 0   
w = 0   
h = 0   
nuclei = []   
count = 0   
number_name = 1   

img = cv2.imread('7.bmp')
img = cv2.add(img, 0.70)
img_hsv = cv2.cvtColor(img, cv2.COLOR_BGR2HSV)   
mask1 = cv2.inRange(img_hsv, (90,90,0), (255,255,255))  
mask2 = cv2.inRange(img_hsv, (70,100,0), (255,255,255)) 
mask = mask1 + mask2  
kernel = np.ones((1,3),np.uint8)  
mask = cv2.dilate(mask,kernel,iterations = 2)   
mask = cv2.morphologyEx(mask, cv2.MORPH_OPEN, kernel)  
mask_blur = cv2.medianBlur(mask,5)  
canny = cv2.Canny(mask_blur, 100,300,3) 
im2, contours, hierarchy = cv2.findContours(canny,cv2.RETR_EXTERNAL,cv2.CHAIN_APPROX_SIMPLE)  

for cnt in contours:   
    if cv2.contourArea(cnt) >= limit_area:   
        nuclei.append(cnt)
        print(cv2.contourArea(cnt))
        x, y, w, h = cv2.boundingRect(cnt)
        cv2.rectangle(img, (x, y), (x+w, y+h), (0,255,0), 7)

cv2.imshow('img', img)
cv2.waitKey(0)
cv2.destroyAllWindows()
edit retag flag offensive close merge delete

Comments

1

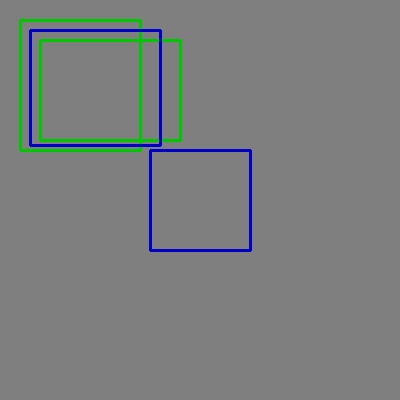
Non maximum suppression is what you need.

Rex Low gravatar imageRex Low ( 2018-12-02 05:42:11 -0600 )edit
1

^^ easier said, than done ! ;)

berak gravatar imageberak ( 2018-12-02 08:01:39 -0600 )edit

3 answers

Sort by ยป oldest newest most voted
2

answered 2018-12-02 07:48:37 -0600

updated 2018-12-02 13:38:08 -0600

Yes, groupRectangles is good to solve your problem.

i can't provide python code but i want to mention some hints

it seems the documentation about the function is confusing.you can use only variant of the function below

void cv::groupRectangles    (   std::vector< Rect > &   rectList,
std::vector< int > &    weights,
int     groupThreshold,
double  eps = 0.2 
)       
Python:
rectList, weights   =   cv.groupRectangles( rectList, groupThreshold[, eps] )

also have a look at faster-non-maximum-suppression-python for an alternative way

EDIT 1:

combined your code and @berak 's answer

see red lines only ( i used the image above)

import cv2
import numpy as np

def draw(rects,color):
 for r in rects:
  p1 = (r[0], r[1])
  p2 = (r[0]+r[2], r[1]+r[3])
  cv2.rectangle(img, p1,p2, color,4)

limit_area = 500   
x = 0   
y = 0   
w = 0   
h = 0   
nuclei = []   
count = 0   
number_name = 1   

img = cv2.imread('e:/t.png')
img = cv2.add(img, 0.70)
img_hsv = cv2.cvtColor(img, cv2.COLOR_BGR2HSV)   
mask1 = cv2.inRange(img_hsv, (90,90,0), (255,255,255))  
mask2 = cv2.inRange(img_hsv, (70,100,0), (255,255,255)) 
mask = mask1 + mask2  
kernel = np.ones((1,3),np.uint8)  
mask = cv2.dilate(mask,kernel,iterations = 2)   
mask = cv2.morphologyEx(mask, cv2.MORPH_OPEN, kernel)  
mask_blur = cv2.medianBlur(mask,5)  
canny = cv2.Canny(mask_blur, 100,300,3) 
contours, hierarchy = cv2.findContours(canny,cv2.RETR_EXTERNAL,cv2.CHAIN_APPROX_SIMPLE)  

rects = []
for cnt in contours:   
    if cv2.contourArea(cnt) >= limit_area:   
        nuclei.append(cnt)
        print(cv2.contourArea(cnt))
        x, y, w, h = cv2.boundingRect(cnt)
        rects.append([x, y, w, h])
        rects.append([x, y, w, h])

rects,weights = cv2.groupRectangles(rects, 1, 1.5)
draw(rects, (0,0,255))
cv2.imshow('img', img)
cv2.waitKey(0)
cv2.destroyAllWindows()

image description

edit flag offensive delete link more

Comments

1

hah, i tried that, and the problem is (docs):

Then, the small clusters containing less than or equal to groupThreshold rectangles are rejected.

it will average the 2 bottom rects, but also reject the 2 top ones (leaving us with a single rect in the list)

(sounds like "weird behaviour" at first thought, but makes sense in the context of haar or hog classifiers, where we actually want to reject clusters with not enough confidence / members)

berak gravatar imageberak ( 2018-12-02 08:00:38 -0600 )edit
1

@berak could you try again and append all rect twice to rectList (i forgot the main hint in the answer :) )

sturkmen gravatar imagesturkmen ( 2018-12-02 08:08:06 -0600 )edit
1

yea, that works perfect !

berak gravatar imageberak ( 2018-12-02 08:28:51 -0600 )edit

i think this is tricky way but need some trial experience about finding right eps and maybe appending more rects

sturkmen gravatar imagesturkmen ( 2018-12-02 13:42:33 -0600 )edit

is there a way i can determine the value of epsilon to use on an image? and can i also make the rectangle larger? i need the whole nucleus to be inside the box, but i have no idea how to do that

XTSR gravatar imageXTSR ( 2018-12-02 16:44:30 -0600 )edit

could you provide some more images

sturkmen gravatar imagesturkmen ( 2018-12-02 18:56:07 -0600 )edit

with the same problems such as the one on the post?

XTSR gravatar imageXTSR ( 2018-12-02 18:57:17 -0600 )edit

maybe i can suggest some better way.i want to see some random different images.

sturkmen gravatar imagesturkmen ( 2018-12-02 19:08:39 -0600 )edit

oh ok, here are some images

XTSR gravatar imageXTSR ( 2018-12-02 19:56:52 -0600 )edit
1

like the changes below works good without using groupRectangles

kernel = np.ones((3,3),np.uint8)  
mask = cv2.dilate(mask,kernel,iterations = 5)
sturkmen gravatar imagesturkmen ( 2018-12-02 21:15:16 -0600 )edit
2

answered 2018-12-02 08:39:16 -0600

berak gravatar image

updated 2018-12-02 08:40:47 -0600

so taking on @sturkmen 's idea, we can use groupRectangles() .

to make sure, we retain "single" boxes, we have to duplicate them, so even a single box lands in a cluster of it's own ;)

here's an example:

# just for visualization:
def draw(rects,color):
 for r in rects:
  p1 = (r[0], r[1])
  p2 = (r[0]+r[2], r[1]+r[3])
  cv2.rectangle(ocv, p1,p2, color,2)

# draw image
ocv = np.ones((400,400,3),np.uint8) * 127

# demo array of 3 rects (the 1st 2 overlap and should be merged):
rects = [[20,20,120,130], [40,40,140,100], [150,150,100,100]]
draw(rects,(0,200,0))

# duplicate all of them ;)
l = len(rects)
for r in range(l):
  rects.append(rects[r])

# min cluster size = 2, min distance = 0.5:    
rects,weights = cv2.groupRectangles(rects, 1, .5)
draw(rects, (200,0,0))

print(rects)
print(weights)

[[ 30  30 130 115]
 [150 150 100 100]]
[[4]
 [2]]

edit flag offensive delete link more
1

answered 2018-12-02 06:06:21 -0600

Rex Low gravatar image

You can obtain the rectangle with minAreaRect. Or you could also try Non-Maximum Suppression.

rects = []
for cnt in contours:   
    if cv2.contourArea(cnt) >= limit_area:
        x, y, w, h = cv2.boundingRect(cnt)
        rects.append((x, y))
        rects.append((x+w, y+h))

box = cv.minAreaRect(np.asarray(arr))
pts = cv.boxPoints(box) # 4 outer corners
edit flag offensive delete link more

Comments

i got the points now, what could i do with the points?

XTSR gravatar imageXTSR ( 2018-12-02 08:30:12 -0600 )edit
1

You could try to draw a rectangle with the points.

Rex Low gravatar imageRex Low ( 2018-12-02 08:33:24 -0600 )edit

@XTSR .Follow example from Rex Low. The groupRectangles is not right for you.

supra56 gravatar imagesupra56 ( 2018-12-02 11:00:17 -0600 )edit
1

indeed i did not downwote but this is not a right answer. it produces one big rectangle see http://answers.opencv.org/question/20...

sturkmen gravatar imagesturkmen ( 2018-12-02 13:52:43 -0600 )edit

Question Tools

1 follower

Stats

Asked: 2018-12-02 01:10:34 -0600

Seen: 9,693 times

Last updated: Dec 02 '18