Ask Your Question
0

Frequential Analysis in openCV

asked 2017-07-17 02:53:34 -0600

arqam gravatar image

updated 2017-07-17 04:32:43 -0600

berak gravatar image

I am going through a research paper and trying to implement it. In the paper it is saying :

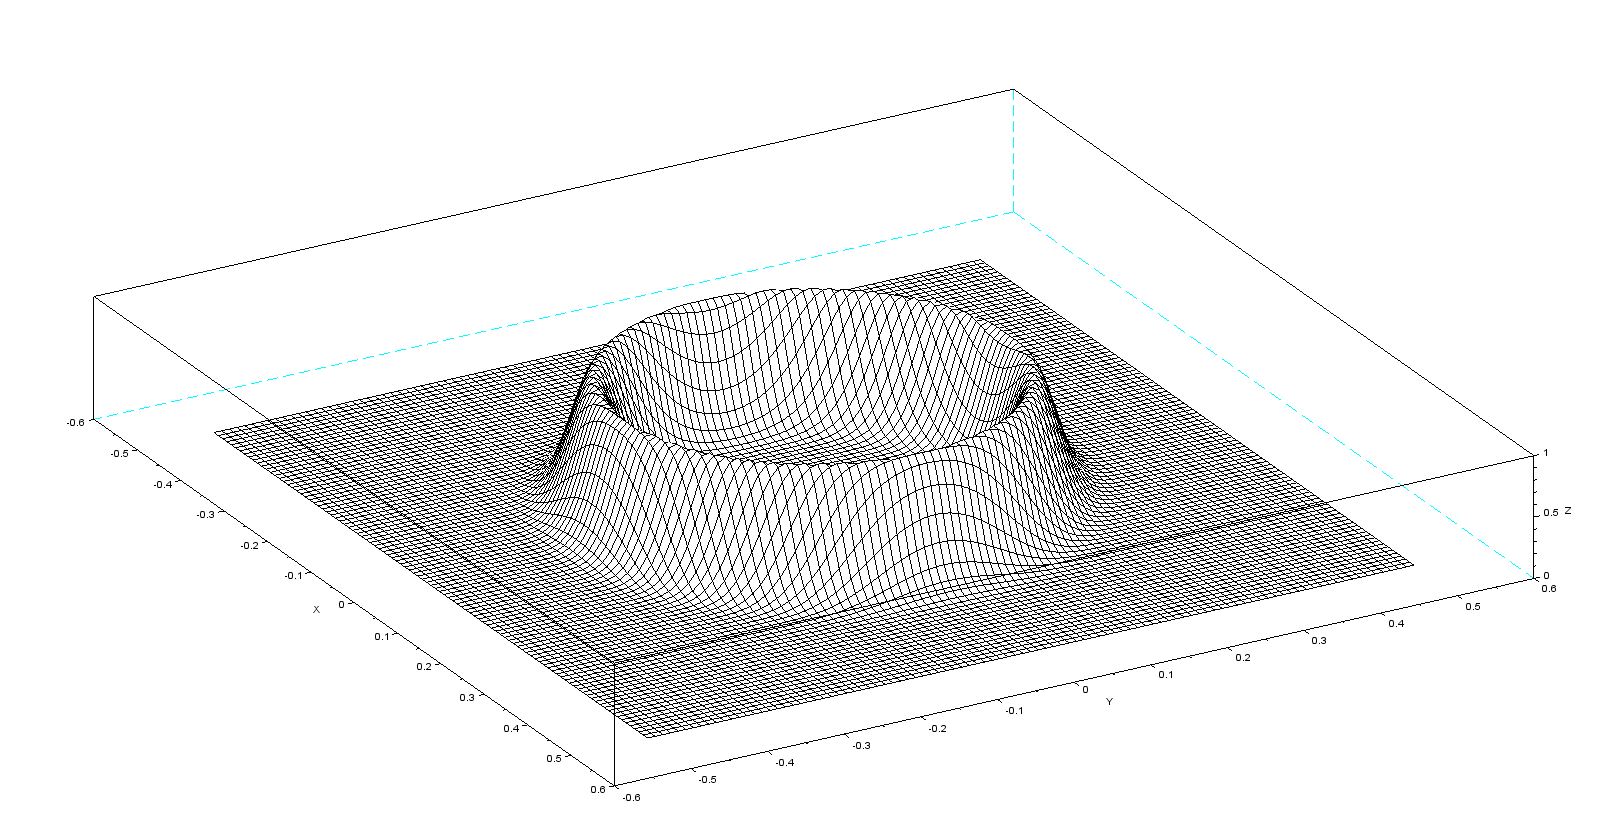
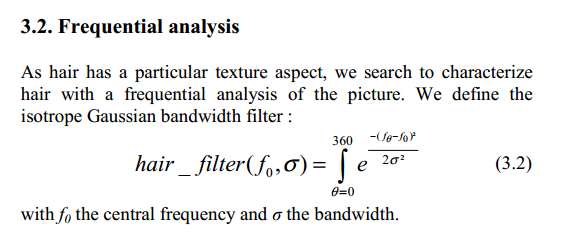
That they use the isotrope Gaussian bandwidth Filter, giving a formula and then using the formula they get the frequential map.

My question being, how to apply a particular formula to the matrix image (Section 3.2), and what is the frequential map, as in what format it is?

Link for the paper : Frequential and color analysis for hair mask segmentation

PS : Its difficult for me to write the equation over here, so please bear with me.

image description

edit retag flag offensive close merge delete

2 answers

Sort by ยป oldest newest most voted
4

answered 2017-07-17 03:25:23 -0600

LBerger gravatar image

updated 2018-01-26 09:52:13 -0600

I understand that filter is defined in frequency domain: fourier transform of image, multiply by filter and inverse fourier transform and it gives you frequential_mask(i, j)

Python code :

import matplotlib.pyplot as plt
import matplotlib.gridspec as gridspec
from mpl_toolkits.mplot3d.axes3d import Axes3D
import numpy as np
import cv2 as cv

def hairFilter(fx, fy ,f0, sigma):
     f = np.sqrt(fx**2+fy**2);
     return np.exp(-(f0-f)**2/(sigma*sigma))

fx = np.linspace(-0.5, 0.5, 200)
print ( fx.shape )
fy = np.linspace(-0.5, 0.5, 200)
X,Y = np.meshgrid(fx, fy)
f0 = 0.1
sigma = 0.04
hf=hairFilter(X,Y,f0,sigma)
fig = plt.figure(figsize=(14,6))

fig = plt.figure(figsize=(8,6))

ax = fig.add_subplot(1, 1, 1, projection='3d')

p = ax.plot_wireframe(X, Y, hf, rstride=4, cstride=4)
plt.show()

image description

edit flag offensive delete link more
0

answered 2018-01-25 07:01:11 -0600

Ivan888 gravatar image

Thanks LBerger!

As I understand second step is "multiply by filter"... but how to calculate appropriate convolution kernel and how to apply it in frequential domain? Please see below code:

img = cv2.imread("sad.jpg", 0)

# fft to convert the image to freq domain
f = np.fft.fft2(img)

**#  HOW TO APPLY GAUSSIAN FILTER HERE ?**

# inverse fft to get the image back
img_back = np.fft.ifft2(f)

img_back = np.abs(img_back)

plt.subplot(131), plt.imshow(img, cmap = 'gray')
plt.title('Input image'), plt.xticks([]), plt.yticks([])
plt.subplot(132), plt.imshow(img_back, cmap = 'gray')
plt.title('Image after HPF'), plt.xticks([]), plt.yticks([])
plt.subplot(133), plt.imshow(img_back)
plt.title('Final result'), plt.xticks([]), plt.yticks([])


plt.show()
edit flag offensive delete link more

Comments

@Ivan888 , please do not post answers here, if you have a question or comment.

berak gravatar imageberak ( 2018-01-25 08:50:49 -0600 )edit

Question Tools

1 follower

Stats

Asked: 2017-07-17 02:53:34 -0600

Seen: 701 times

Last updated: Jan 26 '18