about opencv plot [closed]

asked 2017-07-04 13:58:58 -0600

captain_sobel gravatar image

Hello, I have used the plot function to plot the data of the Mat, but the result is inverted(up/down), when value is getting lower the curve is going up, to a higher values it's going down. It's my problem or the plot function is like that? image description

edit retag flag offensive reopen merge delete

Closed for the following reason the question is answered, right answer was accepted by sturkmen
close date 2017-11-12 00:16:43.064304

Comments

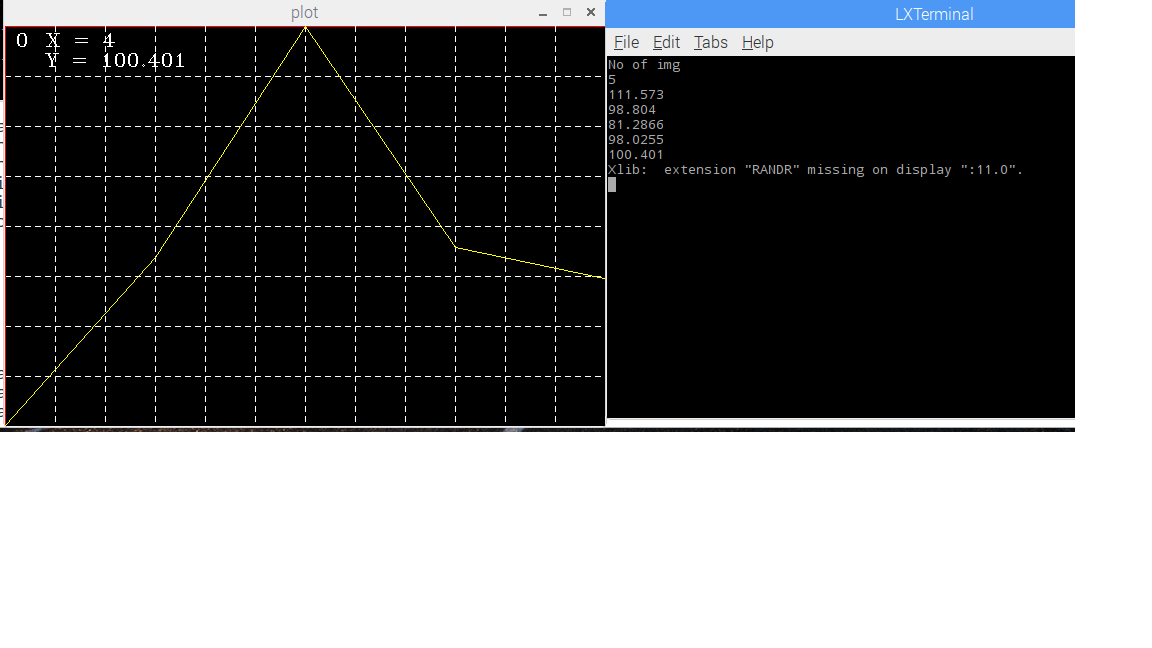
yea, the wrong y axis is a bug. (y points up in maths, but down in image world)

berak gravatar imageberak ( 2017-07-05 04:17:34 -0600 )edit

thanks for reply, but is there any way the solve the problem?

captain_sobel gravatar imagecaptain_sobel ( 2017-07-05 09:50:29 -0600 )edit
sturkmen gravatar imagesturkmen ( 2017-09-15 18:53:06 -0600 )edit