Creating Polar Histogram on Contour Segment
I am using OpenCV 3.1.1 on a Win10 64bit machine with C++.
I am attempting to implement the approach in Xingang, et al., "Bag of Contour Fragments for Robust Shape Classification" (2014). http://dl.acm.org/citation.cfm?id=258...
One aspect of that paper involves creating a sort of polar histogram of contour segments.
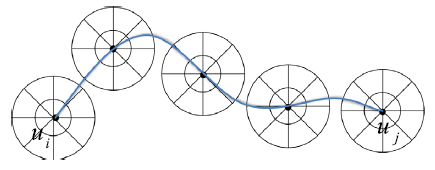
On a contour segment, five points are picked. At each point, two histograms are/a single combined histogram is created: 1) the angle space is divided into 10 bins; and 2) the radius space is divided into 6 bins. This was done in Matlab which has a "polarhistogram" function that computes all of this.
My question is: what is the easiest way to do this in OpenCV?
Thanks for any help.
one idea would be: split your contour into seperate x,y arrays, apply cartToPolar to get magnitude and angle, and then simply "bin" (or "quantify" ? what's the word here ?) those
Thanks Berak. This is the kind of thing I was struggling with. I was thinking that there might be some OpenCV counterpart to the Matlab "polarhistogram" that was no jumping out at me. Instead, I will just write my own.
Once you do have it, please submit a PR with the functioning code. This polarhistogram can be a step to implementing more techniques depending on this (and there are actually quite alot of those)!