Ask Your Question
0

contour detection and distance measurement

asked 2016-09-12 15:20:00 -0600

tyler.royer gravatar image

Hi

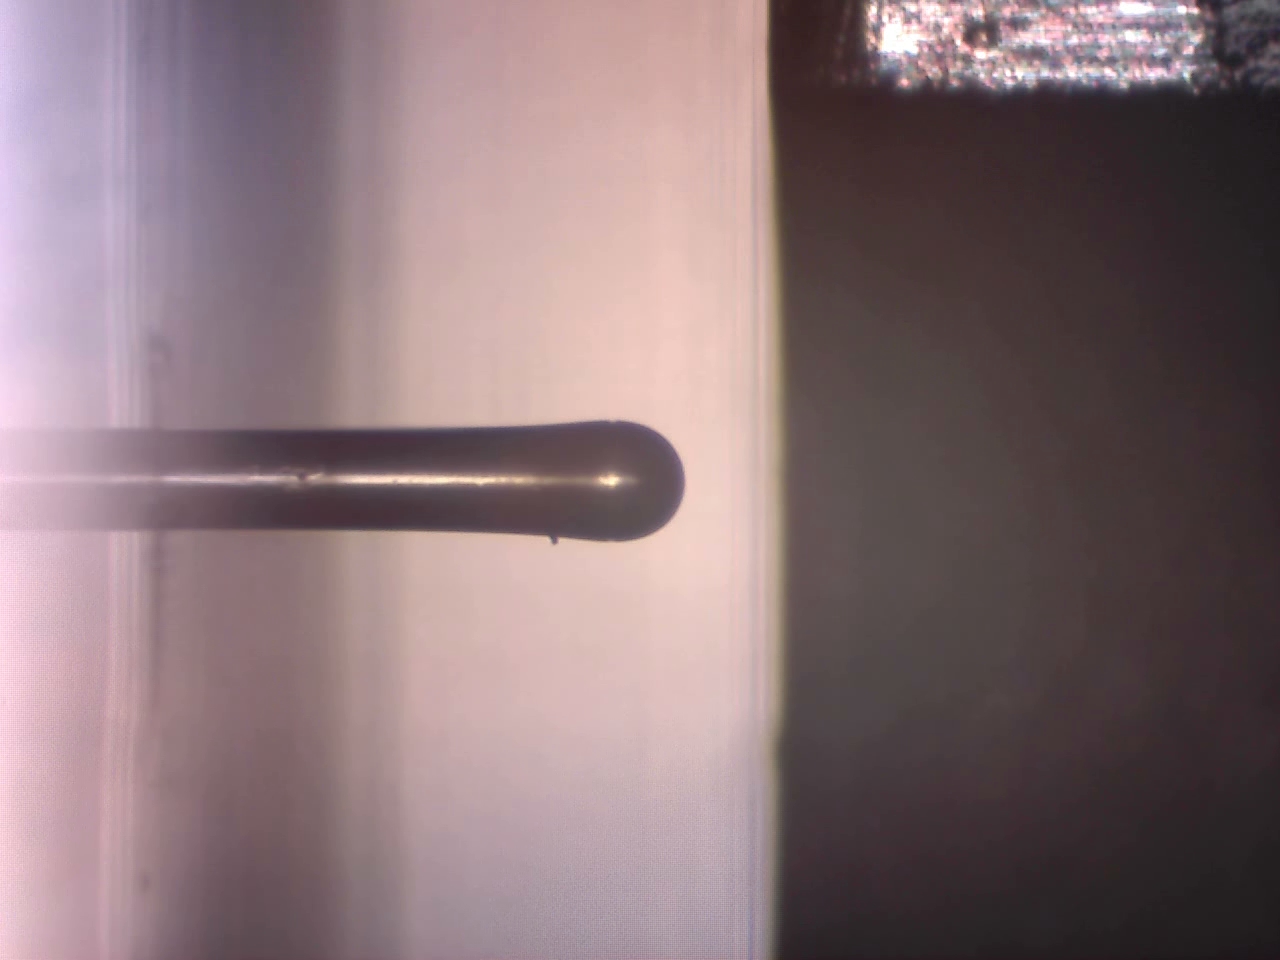
I am trying to find the distance between an optical fiber and a reference plane.

The code I am using sees the external profile of the fiber but only generates a small contour around it and only find the flat metal surface in the top right.

The end of the fiber is match headed in this example, in most cases it will be a flat edge.

TL;DR I want to generate a rectangle around the fiber and measure the distance to the reference surface. I know how to do the distance measurement, getting the polygon around the fiber and detecting the reference surface is my issue.

The image comes from a live camera feed, where the fiber does not exist and the reference plane can float in direction a good bit but generally looks like the image below

image description

edit retag flag offensive close merge delete

1 answer

Sort by ยป oldest newest most voted
1

answered 2016-09-12 22:01:45 -0600

Tetragramm gravatar image

What here is the exact distance you're trying to measure? Between the tip and the vertical black?

Is the fiber always black and the reference surface always black while the rest is light colored? If so it might be pretty easy.

Since you're already doing contour detection, I'm assuming you know the basics.

Convert the image to grayscale and use a threshold to binarize the image between black and white. (This may take some work to get right. I just picked 100 as my threshold, and it worked great, but I expect you may not have totally consistent lighting.)

image description

Now perform connected components (if you do the with stats version it gives you the bounding boxes already.) and you can see that your two largest components are the reference surface and the fiber. You can also distinguish the fiber because it's more rectangle than square and in the middle of the frame. (Again, up to your situation). So now you have the bounding box, and the edge of the surface, so there you go.

If the assumptions don't hold, edit your question with some more details and we'll se what we can do.

edit flag offensive delete link more

Comments

You're assumptions are accurate.Thank you for your help.

I am using python and the documentation for 3.1.0 does not have a python example only c++

output = cv2.connectedComponentsWithStats(thresh, 4, cv2.CV_32S)
# Get the results
# The first cell is the number of labels
num_labels = output[0]
# The second cell is the label matrix
labels = output[1]
# The third cell is the stat matrix
stats = output[2]
# The fourth cell is the centroid matrix
centroids = output[3]

This is what I have, and I'm not exactly sure how to print out the bounding boxes.

tyler.royer gravatar imagetyler.royer ( 2016-09-13 07:50:43 -0600 )edit

Okay, so I figured out the above issue.

for stat in stats:
    (l,t,w,h,a) = stat
    print(a)
    tl = (l,t)
    br = (l+w,t+h)
    cv2.rectangle(img,tl,br,(0,255,0),3)

This draws the rectangle around all the components, using the area I can limit the components to only be the fiber and the reference.

tyler.royer gravatar imagetyler.royer ( 2016-09-13 08:08:29 -0600 )edit

Question Tools

1 follower

Stats

Asked: 2016-09-12 15:20:00 -0600

Seen: 1,042 times

Last updated: Sep 12 '16