This forum is disabled, please visit https://forum.opencv.org
| | 1 | initial version |
ok, for this task you can try hough line detection
if you have detected the lines you can check some geometrical behavior (e.g. if lines forms a rectangle, which histogram or mean value has the area of the ractangle, and so on..)
try it out:
import cv2
import numpy as np
#img = cv2.imread('C:\Users\wieser\Pictures\IMG_20170912_111444516.jpg')
img = cv2.imread('C:\Users\wieser\Pictures\IMG_20170912_153011325.jpg')
# downscale the image, not the entire information is necessary
img = cv2.resize(img, None, fx=0.3, fy=0.15)
# Convert the img to grayscale
gray = cv2.cvtColor(img, cv2.COLOR_BGR2GRAY)
# remove noise
med = cv2.medianBlur(gray, 21)
# get adaptive threshold
thr = cv2.adaptiveThreshold(med, 255, cv2.ADAPTIVE_THRESH_MEAN_C, cv2.THRESH_BINARY, 21, 2)
# thinner lines
kernel = np.ones((5,5),np.uint8)
thr = cv2.dilate(thr, kernel, iterations=1)
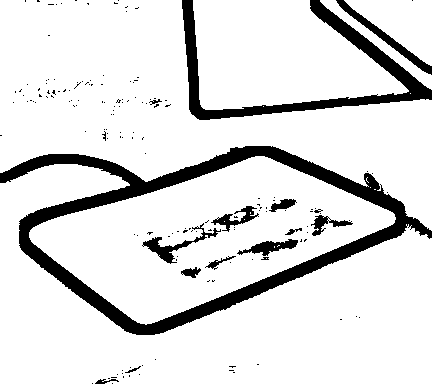
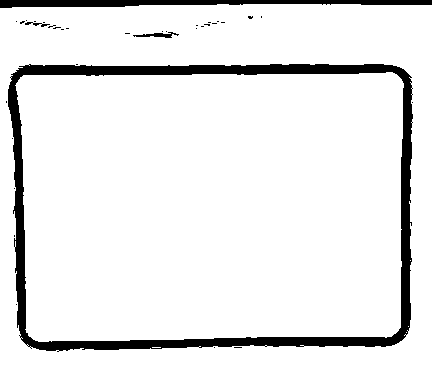
# Apply edge detection method on the image
edges = cv2.Canny(thr, 1, 255, apertureSize=3)
# This returns an array of r and theta values
lines = cv2.HoughLines(edges, 1, np.pi / 180, 80)
# The below for loop runs till r and theta values
# are in the range of the 2d array
for line in lines:
for r, theta in line:
# Stores the value of cos(theta) in a
a = np.cos(theta)
# Stores the value of sin(theta) in b
b = np.sin(theta)
# x0 stores the value rcos(theta)
x0 = a * r
# y0 stores the value rsin(theta)
y0 = b * r
# x1 stores the rounded off value of (rcos(theta)-1000sin(theta))
x1 = int(x0 + 1000 * (-b))
# y1 stores the rounded off value of (rsin(theta)+1000cos(theta))
y1 = int(y0 + 1000 * (a))
# x2 stores the rounded off value of (rcos(theta)+1000sin(theta))
x2 = int(x0 - 1000 * (-b))
# y2 stores the rounded off value of (rsin(theta)-1000cos(theta))
y2 = int(y0 - 1000 * (a))
# cv2.line draws a line in img from the point(x1,y1) to (x2,y2).
# (0,0,255) denotes the colour of the line to be
# drawn. In this case, it is red.
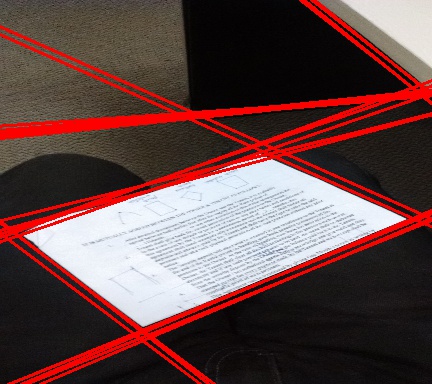
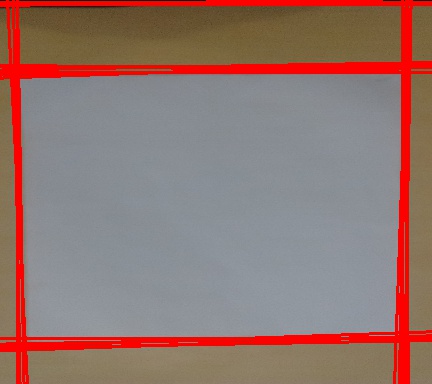
cv2.line(img, (x1, y1), (x2, y2), (0, 0, 255), 2)
cv2.imshow('im',img)
cv2.waitKey()
p.s.: parts of the code are from here (http://www.geeksforgeeks.org/line-detection-python-opencv-houghline-method/)
| | 2 | No.2 Revision |
ok, for this task you can try hough line detection
if you have detected the lines you can check some geometrical behavior (e.g. if lines forms a rectangle, which histogram or mean value has the area of the ractangle, and so on..)
try it out:
import cv2
import numpy as np

#img = cv2.imread('C:\Users\wieser\Pictures\IMG_20170912_111444516.jpg')
img = cv2.imread('C:\Users\wieser\Pictures\IMG_20170912_153011325.jpg')

# downscale the image, not the entire information is necessary
img = cv2.resize(img, None, fx=0.3, fy=0.15)

# Convert the img to grayscale
gray = cv2.cvtColor(img, cv2.COLOR_BGR2GRAY)

# remove noise
med = cv2.medianBlur(gray, 21)

# get adaptive threshold
thr = cv2.adaptiveThreshold(med, 255, cv2.ADAPTIVE_THRESH_MEAN_C, cv2.THRESH_BINARY, 21, 2)

# thinner lines
kernel = np.ones((5,5),np.uint8)
thr = cv2.dilate(thr, kernel, iterations=1)

# Apply edge detection method on the image
edges = cv2.Canny(thr, 1, 255, apertureSize=3)

# This returns an array of r and theta values
lines = cv2.HoughLines(edges, 1, np.pi / 180, 80)


# The below for loop runs till r and theta values
# are in the range of the 2d array
for line in lines:
    for r, theta in line:
        # Stores the value of cos(theta) in a
        a = np.cos(theta)

        # Stores the value of sin(theta) in b
        b = np.sin(theta)

        # x0 stores the value rcos(theta)
        x0 = a * r

        # y0 stores the value rsin(theta)
        y0 = b * r

        # x1 stores the rounded off value of (rcos(theta)-1000sin(theta))
        x1 = int(x0 + 1000 * (-b))

        # y1 stores the rounded off value of (rsin(theta)+1000cos(theta))
        y1 = int(y0 + 1000 * (a))

        # x2 stores the rounded off value of (rcos(theta)+1000sin(theta))
        x2 = int(x0 - 1000 * (-b))

        # y2 stores the rounded off value of (rsin(theta)-1000cos(theta))
        y2 = int(y0 - 1000 * (a))

        # cv2.line draws a line in img from the point(x1,y1) to (x2,y2).
        # (0,0,255) denotes the colour of the line to be
        # drawn. In this case, it is red.
        cv2.line(img, (x1, y1), (x2, y2), (0, 0, 255), 2)

cv2.imshow('im',img)
cv2.waitKey()
p.s.: parts of the code are from here (http://www.geeksforgeeks.org/line-detection-python-opencv-houghline-method/)
here are the preresults:
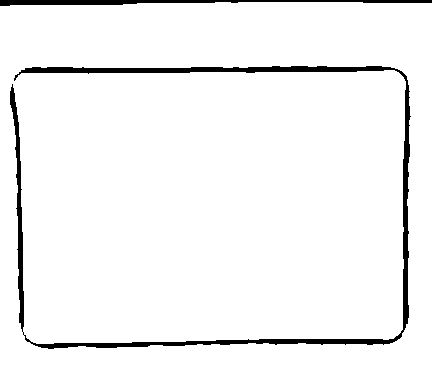
image1:
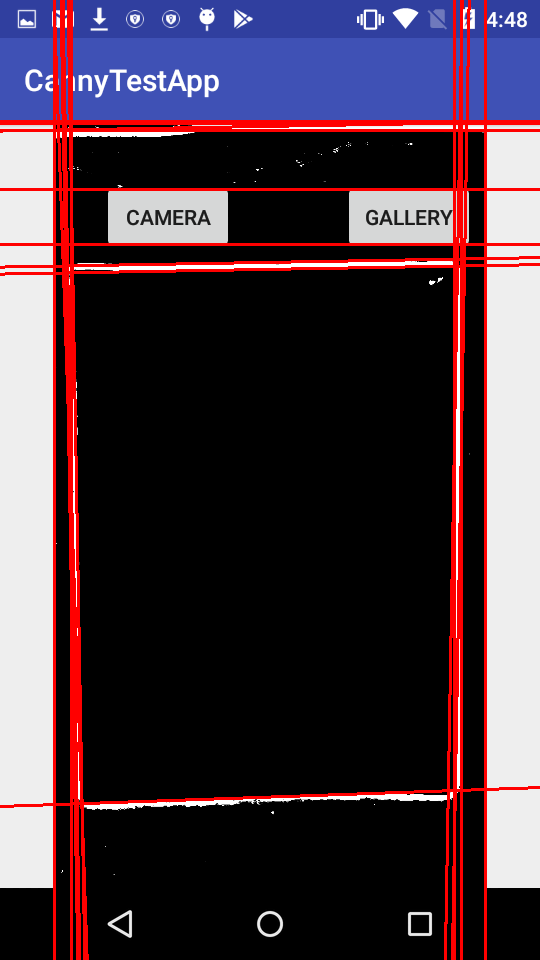
image2:
| | 3 | No.3 Revision |
ok, for this task you can try hough line detection
if you have detected the lines you can check some geometrical behavior (e.g. if lines forms a rectangle, which histogram or mean value has the area of the ractangle, and so on..)
try it out:
import cv2
import numpy as np

#img = cv2.imread('C:\Users\wieser\Pictures\IMG_20170912_111444516.jpg')
img = cv2.imread('C:\Users\wieser\Pictures\IMG_20170912_153011325.jpg')

# downscale the image, not the entire information is necessary
img = cv2.resize(img, None, fx=0.3, fy=0.15)

# Convert the img to grayscale
gray = cv2.cvtColor(img, cv2.COLOR_BGR2GRAY)

# remove noise
med = cv2.medianBlur(gray, 21)

# get adaptive threshold
thr = cv2.adaptiveThreshold(med, 255, cv2.ADAPTIVE_THRESH_MEAN_C, cv2.THRESH_BINARY, 21, 2)

# thinner lines
kernel = np.ones((5,5),np.uint8)
thr = cv2.dilate(thr, kernel, iterations=1)

# Apply edge detection method on the image
edges = cv2.Canny(thr, 1, 255, apertureSize=3)

# This returns an array of r and theta values
lines = cv2.HoughLines(edges, 1, np.pi / 180, 80)


# The below for loop runs till r and theta values
# are in the range of the 2d array
for line in lines:
    for r, theta in line:
        # Stores the value of cos(theta) in a
        a = np.cos(theta)

        # Stores the value of sin(theta) in b
        b = np.sin(theta)

        # x0 stores the value rcos(theta)
        x0 = a * r

        # y0 stores the value rsin(theta)
        y0 = b * r

        # x1 stores the rounded off value of (rcos(theta)-1000sin(theta))
        x1 = int(x0 + 1000 * (-b))

        # y1 stores the rounded off value of (rsin(theta)+1000cos(theta))
        y1 = int(y0 + 1000 * (a))

        # x2 stores the rounded off value of (rcos(theta)+1000sin(theta))
        x2 = int(x0 - 1000 * (-b))

        # y2 stores the rounded off value of (rsin(theta)-1000cos(theta))
        y2 = int(y0 - 1000 * (a))

        # cv2.line draws a line in img from the point(x1,y1) to (x2,y2).
        # (0,0,255) denotes the colour of the line to be
        # drawn. In this case, it is red.
        cv2.line(img, (x1, y1), (x2, y2), (0, 0, 255), 2)

cv2.imshow('im',img)
cv2.waitKey()
p.s.: parts of the code are from here (http://www.geeksforgeeks.org/line-detection-python-opencv-houghline-method/)
here are the preresults:
image1:
image2:
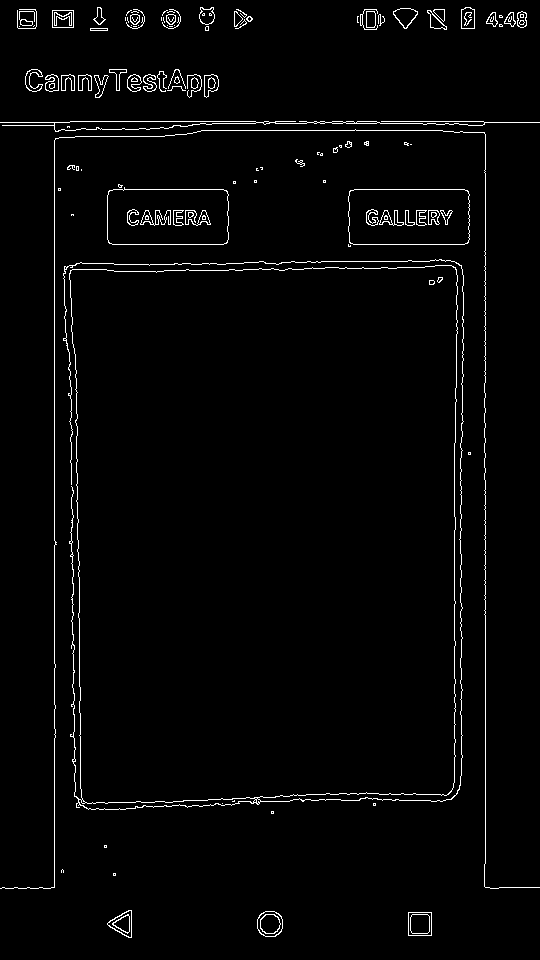
Update 2: result canny