This forum is disabled, please visit https://forum.opencv.org
| | 1 | initial version |
I understand that filter is defined in frequency domain: fourier transform of image, multiply by filter and inverse fourier transform and it gives you frequential_mask(i, j)
| | 2 | No.2 Revision |
I understand that filter is defined in frequency domain: fourier transform of image, multiply by filter and inverse fourier transform and it gives you frequential_mask(i, j)
Scilab code :
function h=hairFilter(f0,sigma,x,y)
f=sqrt(x.^2+y.^2);
h=exp(-(f0-f).^2/(sigma*sigma));
endfunction
[x y]=meshgrid(-0.5:1/100:0.5,-0.5:1/100:0.5);
f0=1/4;
sigma=0.04;
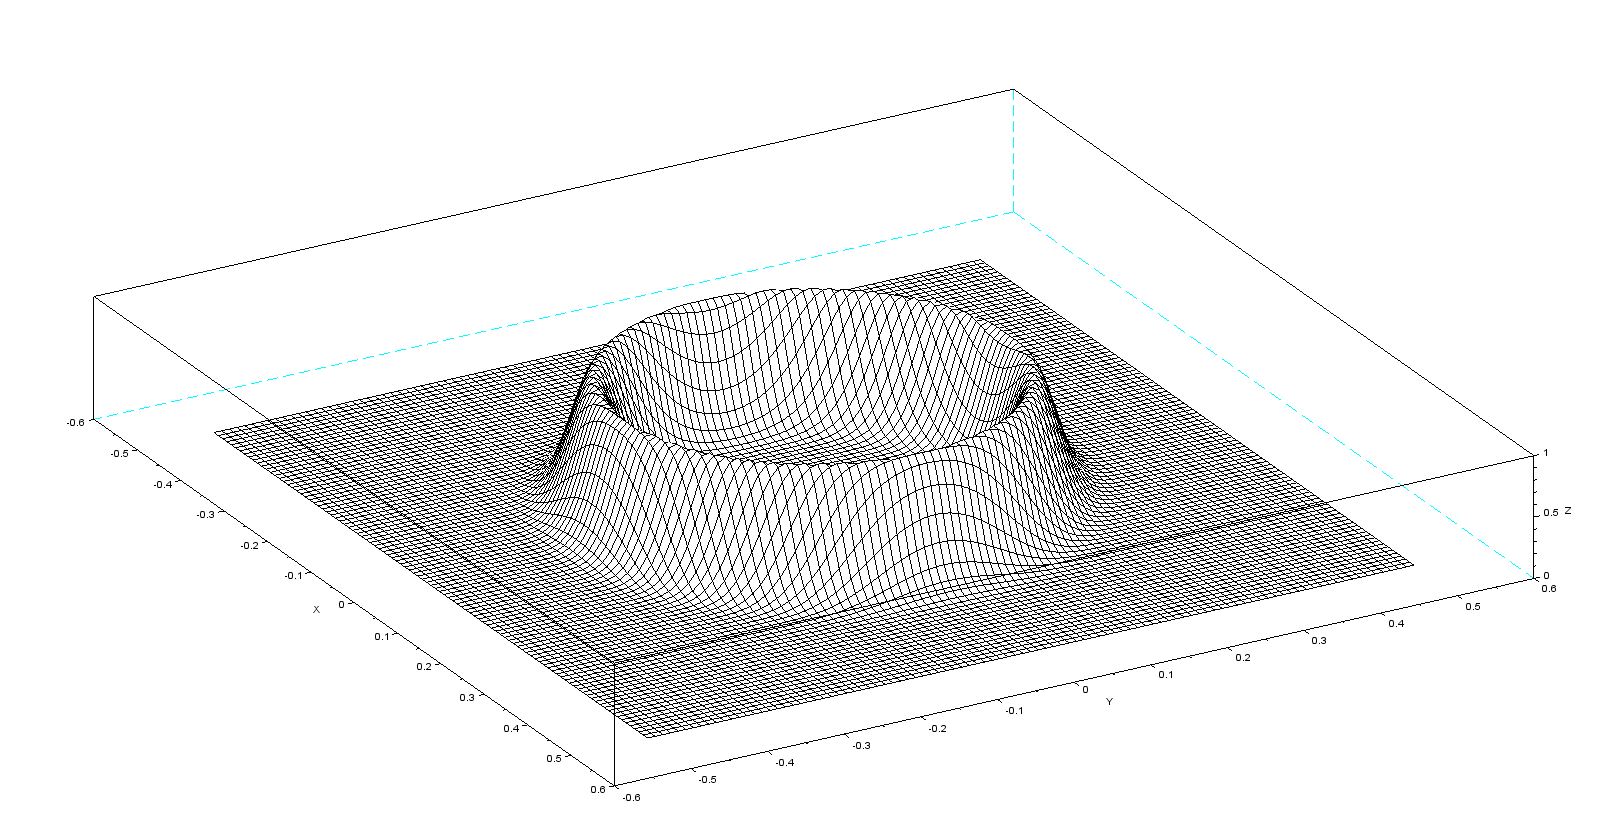
h=hairFilter(f0,sigma,x,y);
mesh(x,y,h)
| | 3 | No.3 Revision |
I understand that filter is defined in frequency domain: fourier transform of image, multiply by filter and inverse fourier transform and it gives you frequential_mask(i, j)
Scilab Python code :
function h=hairFilter(f0,sigma,x,y)
import matplotlib.pyplot as plt
import matplotlib.gridspec as gridspec
from mpl_toolkits.mplot3d.axes3d import Axes3D
import numpy as np
import cv2 as cv

def hairFilter(fx, fy ,f0, sigma):
 f=sqrt(x.^2+y.^2);
 f = np.sqrt(fx**2+fy**2);
 h=exp(-(f0-f).^2/(sigma*sigma));
endfunction
 return np.exp(-(f0-f)**2/(sigma*sigma))
 [x y]=meshgrid(-0.5:1/100:0.5,-0.5:1/100:0.5);
f0=1/4;
sigma=0.04;
fx = np.linspace(-0.5, 0.5, 200)
print ( fx.shape )
fy = np.linspace(-0.5, 0.5, 200)
X,Y = np.meshgrid(fx, fy)
f0 = 0.1
sigma = 0.04
hf=hairFilter(X,Y,f0,sigma)
fig = plt.figure(figsize=(14,6))
 h=hairFilter(f0,sigma,x,y);
fig = plt.figure(figsize=(8,6))
 mesh(x,y,h)
ax = fig.add_subplot(1, 1, 1, projection='3d')

p = ax.plot_wireframe(X, Y, hf, rstride=4, cstride=4)
plt.show()